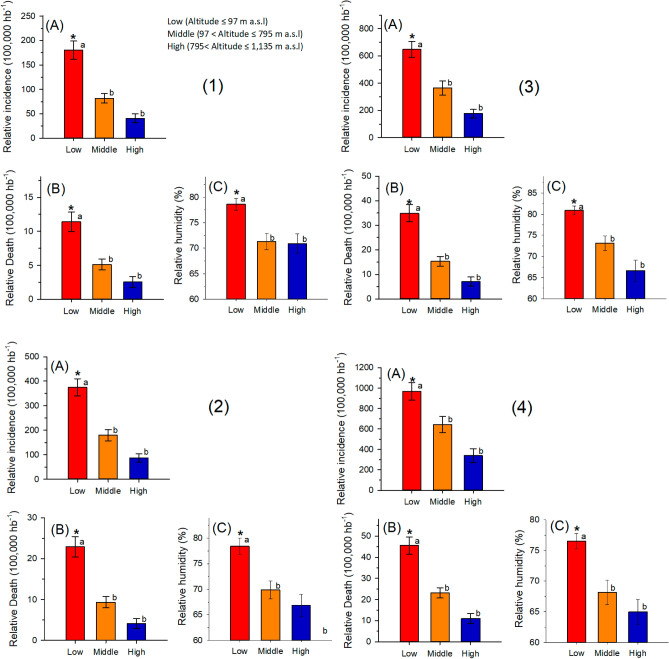
Figure 3.
Mean and standard deviation of (A) relative incidence (RI); (B) relative death rate (RDR) and (C) air relative humidity (RH) at low, medium and high altitudes in cities in Brazil with a population above 200 thousand inhabitants (1) until May 17, 2020; (2) until June, 01, 2020; (3) until June, 16, 2020; (4) until July, 01, 2020. *Significant difference by analysis of variance and average values followed by the same letters (superscript a or superscript b) do not differ by the Tukey test (p < 0.05).

