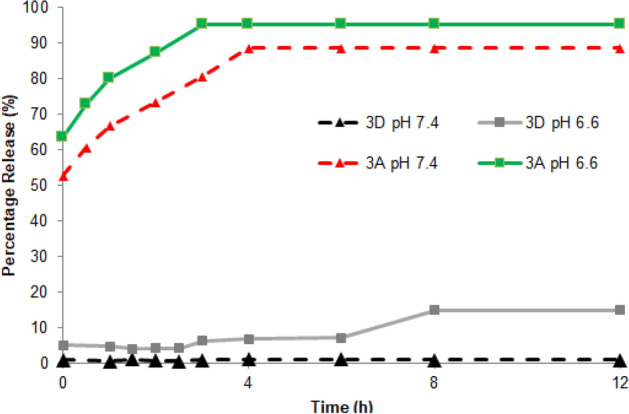
Figure 3.

Compounds 3A and 3D release from nanoparticles at different pH values. Release is reported as a percentage (%) release compared to total fluorescence at the time of sample preparation prior to t = 0 h. Compound 3A loaded nanoparticles show high initial dye release of 53% and 63% for pH 7.4 and 6.6, respectively, at t = 0 h. Release of compound 3A increased (t = 0 h to t = 4 h) to and plateaued (t = 4 h to t = 12 h) at 89% and 95% for pH 7.4 and 6.6, respectively. Compound 3D loaded nanoparticles released far less dye overall from t = 0 h to t = 12 h. Compound 3D showed no release at pH 7.4, 0.9% at t = 0 h to 1.0% at t = 12 h, and a modest release of 5.2% to 6.9% at pH 6.6 t = 0 h to t = 4 h increasing to only 15% by t = 12 h.
