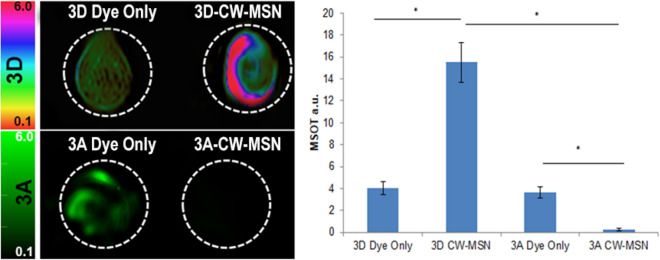
Figure 4.
Optoacoustic imaging of tissue mimicking phantoms containing compounds 3D (top) and 3A (bottom) both as free dye (1 mM) (left) and as dye encapsulated in CW-MSN (0.1 OD) (right). Different colorbar scales are used to denote different dyes (HSB_HSL for compound 3D and green for compound 3A). Dyes 3A and 3D only controls showed similar MSOT signal strengths of 3.6 a.u. and 4.0 a.u., respectively. The optoacoustic signal presented by 3A CW-MSN was significantly lower (0.23 a.u.) than that of 3A dye only. An opposite trend was observed for comparison the optoacoustic signal of 3D dye only control and the signal of 3D CW-MSN, 15.5 a.u., which was significantly higher than both free 3D dye (4.0 a.u. signal) and 3A CW-MSN (0.23 X signal) p < 0.05. The retention of 3D within the CW-MSN is likely due to the hydrophobic nature of the dye in comparison to the more hydrophilic 3A dye.

