Figure 5.
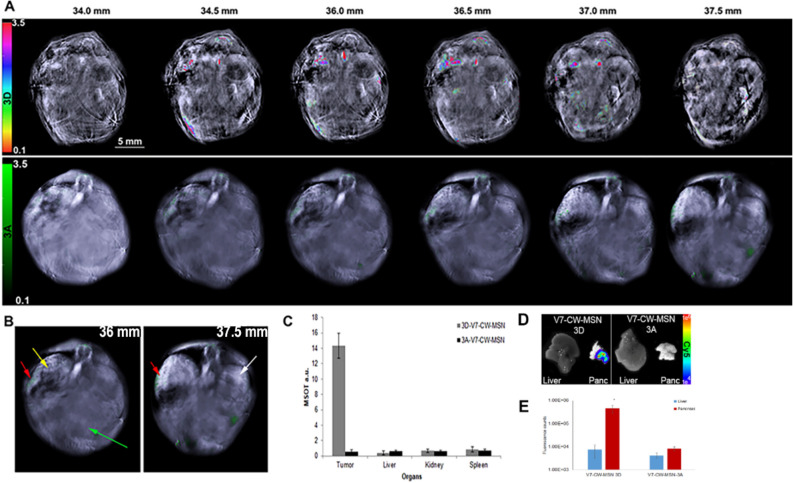
Serial slices (transverse) showing nanoparticle accumulation in orthotopic pancreatic tumor bearing athymic mice. Mice were IV tail-vein injected with 100 µL of V7-CW-MSN at a concentration of 5 μg/mL loaded with either 3A or 3D. The concentration of dye was balanced via an OD of 0.1 dye encapsulated within the V7-CW-MSN. 0.1 OD corresponds to a dye 3A concentration of 150 μg/mL (132 million 3A molecules per particle) and a 3D concentration of 17.5 μg/mL (18 million 3D molecules per particle). Injected mice were imaged at an early time point of 4 h post-injection. Serial cross section of mice injected with 3A V7-CW-MSN (bottom) or 3D V7-CW-MSN (top) are presented together for comparison. Mean tumor size was 3 mm. (A) This image shows serial slices of mice injected with 3A V7-CW-MSN (bottom) or 3D V7-CW-MSN (top) as observed using MSOT. Differences in the background images can be attributed to mouse variation, where adjustments in the background image intensity need to be made in order to better visualize the blood vessels. In this case, the mouse imaged with 3A is much girthier than the mouse imaged with 3D. (B) Organs are identified by arrows: pancreas tumor (yellow), liver (green), spleen (red), kidney (white). (C) 3A V7-CW-MSN optoacoustic signal was low overall and predominantly accumulated in the spleen (0.72 a.u.) with lower signal in the liver (0.61 a.u.), tumor (0.52 a.u.), and kidney (0.62 a.u.). 3D V7-CW-MSN optoacoustic signal preferentially accumulated in the pancreatic tumor (14.3 a.u.), with lower signal corresponding to off-target accumulation for liver (0.42 a.u.), kidney (0.65 a.u.), and spleen (0.81 a.u.). Significant disparity in optoacoustic signal in the major blood vessels for 3A V7-CW-MSN (0.98 a.u.) and 3D V7-CW-MSN (12.1 a.u.) also appeared. (D) Ex vivo images of the liver and pancreas tumor confirmed signals using NIR fluorescence imaging. (E) Quantification of fluorescence signals from liver and pancreas. V7 CW-MSN-3D had significantly higher signal within the pancreas tumor (4.57E + 05 counts) compared to V7 CW-MSN-3A (8.36E + 03 counts) p > 0.0001.

