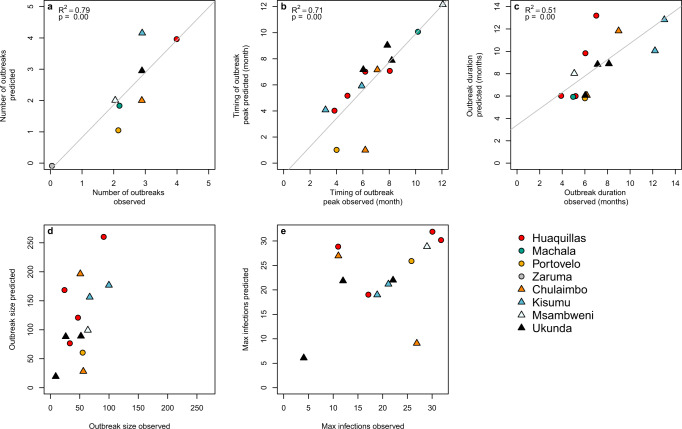
Fig. 3. Model predictions for the number, timing, and duration of arboviral outbreaks closely matched field observations.
Scatterplots show model predictions versus observations for different epidemic characteristics. a The number of outbreaks indicates the total number of predicted and observed outbreaks in a site over the study period. b Timing of outbreak peak, c outbreak duration, d outbreak size, and e maximum infections (e.g., max Ih during an outbreak) correspond to individual outbreaks where model predictions and observations overlapped in time, therefore, some plots show multiple data points per site. Outbreaks are colored by site with different symbols for Ecuador (circles) and Kenya (triangles). We show regression lines and associated statistics (R2 = coefficient of determination; P value = probability of two-sided hypothesis test) for statistically significant relationships. For visualization purposes, we jittered the data points to show overlapping data, and we excluded data from Machala in plots (d) outbreak size and (e) maximum infections because the magnitude differed substantially from all other sites.

