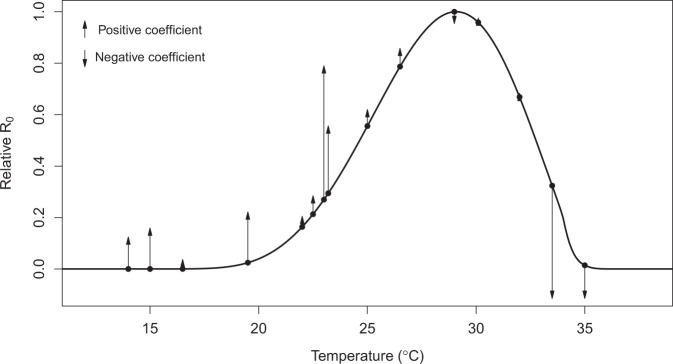
Fig. 7. Independently predicted relative R0 from a model derived from laboratory studies explains differences in the magnitude and direction of the effects of temperature on dengue transmission in the field across varied settings from previous studies.
The black line shows the relative basic reproductive number (R0, normalized to a 0–1 scale) plotted against temperature based on all temperature-dependent traits from19 used in the SEI-SEIR model presented here. Points indicate mean temperature values from previous field-based statistical analyses that related dengue cases with the minimum, maximum, or mean ambient temperature; arrows correspond to the direction (up = positive, down = negative) and relative effect size of the temperature–dengue relationship based on coefficient values from the following studies44,49,68–77. See “Methods” and Supplementary Table 1 for more detail. As expected, the largest observed positive effects of temperature occurred in the rapidly increasing portion of the R0 curve (~22–25 °C; consistent with findings in this study) and the largest observed negative effects occurred well above the predicted optimum, near the upper thermal limit (~33–35 °C).

