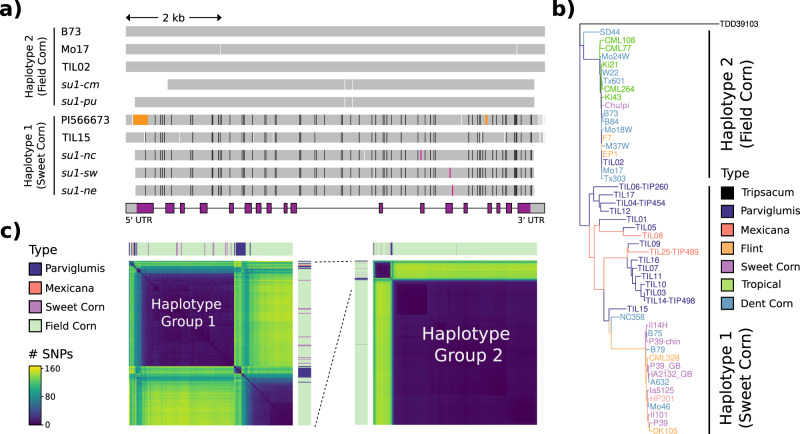
Fig. 4. Two different haplotypes of the su1 locus.
a Haplotypes at the su1 locus. Colored-coded vertical lines represent SNPs or deletions of 5 bp or less relative to the B73 reference sequence. Black lines denote SNPs present in su1-ne, white lines indicate SNPs in other alleles not shared with su1-ne, magenta lines indicate causative agents of the su1-defect, and orange blocks indicate deletions in PI566673115 (Zea mays ssp. mexicana) relative to B73. Every variation from B73 is indicated. In the gene model black lines indicate introns, gray bars indicate untranslated region exons, and purple bars indicate coding sequence exons. The figure is drawn to scale except for a few SNP locations that have been slightly adjusted to allow visual resolution. The sequences of regions not covered by gray bars were not determined. b Neighbor-joining su1 tree rooted in Tripsacum dactyloides, containing teosinte samples and representatives of the two dominant su1 haplotype groups. c Heatmap of the distance matrix calculated from the 165 SNPs within the full length sugary1 gene. The left part of the panel represents a blowup of the full heatmap, presented on the right corner of the same panel. Haplotype group 1 is referred in the text as the sweet corn haplotype while haplotype 2 is the field corn haplotype.

