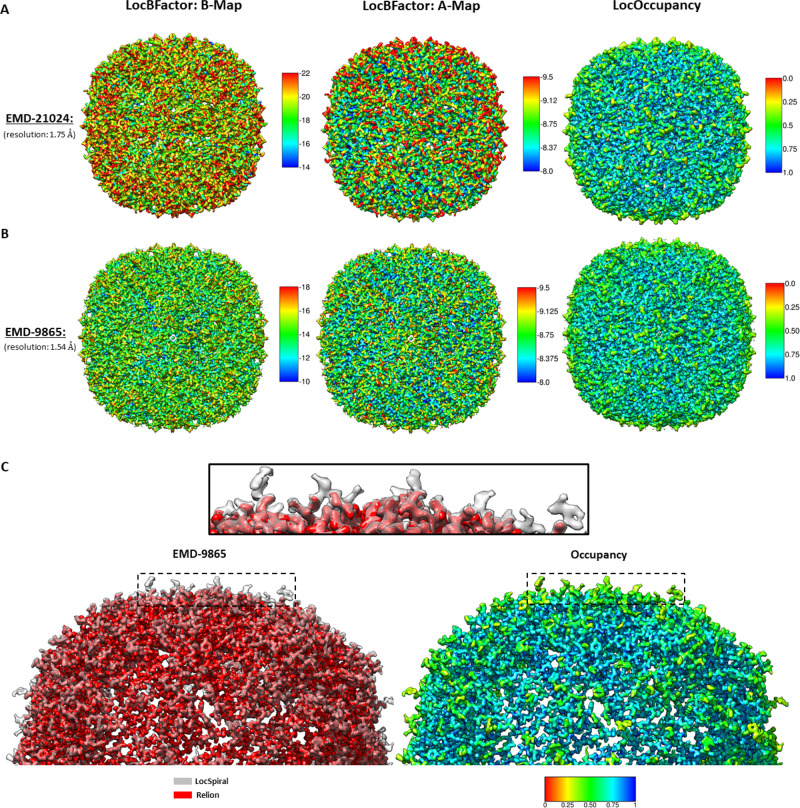
Fig. 3. Results obtained by LocBFactor, LocOccupancy and LocSpiral for apoferritin sample.
Obtained B-maps (local B-factor map corresponding to the slope of the local Guinier plots), A-maps (local values of the logarithm of structure factor amplitudes at 15 Å) and occupancy maps by LocBFactor and LocOccupancy for EMD-21024 (A) and EMD-9865 (B). The B-factor ranges between [−22, −14] Å2 in A and [−18, −10] Å2 in B. The A-map ranges between [−9.5, −8.0] in A and B. The occupancy ranges between [0, 1] in A and B. In C, we show on the left side, superimposed sharpened maps obtained by LocSpiral (grey colour) and Relion (red colour) for EMD-9865. The black rectangle shows a zoomed view of the region indicated with the dashed rectangles. On the right, we show the respective occupancy map obtained by LocOccupancy at the same orientation that these sharpened maps. In this figure, 0 (red colour) indicates no density occupancy and 1 (blue colour) full occupancy.

