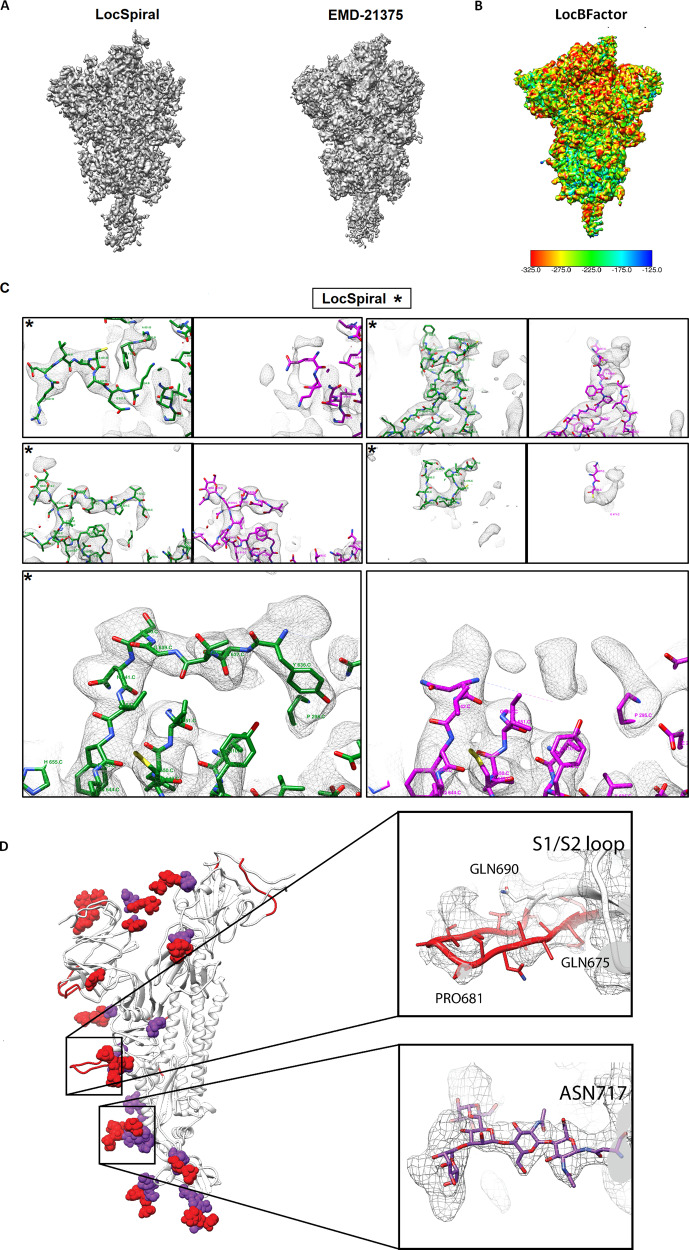
Fig. 5. Results obtained by LocSpiral, LocBFactor and improved atomic model for EMD-21375 SARS-CoV-2 sample.
A Map obtained by LocSpiral approach (left) compared with the map as deposited in EMDB for EMD-21375. B B-factor maps to be used for sharpening (slope of the local Guinier plot multiplied by 4) obtained by LocBFactor approach for EMD-21375. The B-factor ranges between [−325.0, −125.0] Å2. C Visual examples of map regions corresponding to EMD-21375 that could be further modelled after processing the corresponding unfiltered and unsharpened map with LocSpiral approach. On the left and marked with asterisks, we show the LocSpiral maps with the improved atomic models in green, and on the right the deposited EMD-21375 map with the PDB 6vsb in magenta. D In white, PDB 6vsb with traced parts of the glycan proteins marked with purple spheres. In red, additional parts that could be traced using LocSpiral map. Inside the black squares, zoomed views of two glycan proteins that could be further modelled.

