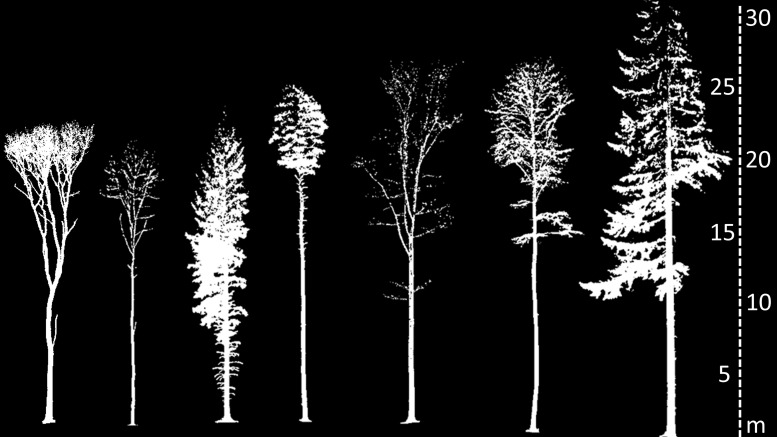
FIGURE 1.
2D representations of 3D point clouds of an exemplary tree of each studied species. From left to right: Sessile oak (Quercus petraea L.), European ash (Fraxinus excelsior L.), Norway spruce (Picea abies L.), Scots pine (Pinus sylvestris L.), red oak (Quercus rubra L.), European beech (Fagus sylvatica L.), and Douglas-Fir [Pseudotzuga menziesii (Mirbel) Franco]. Trees are in scale (see scale bar on the right).

