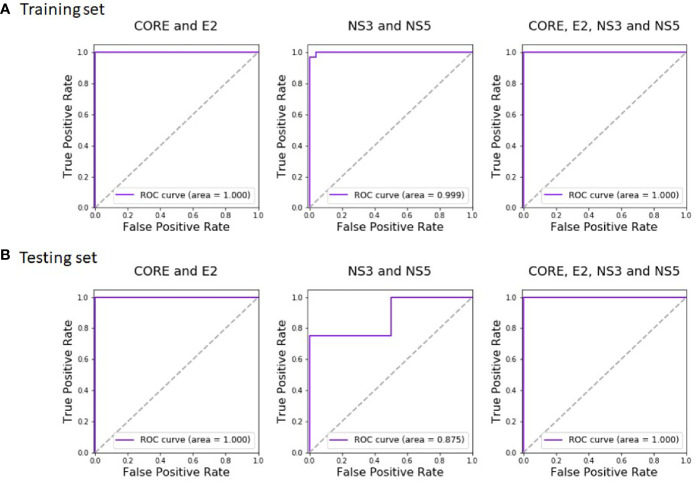
Figure 4.
Random Forest ROC-curves of HCV training set and test set. The curves were plotted based on the (A) training set predictions and (B) test set predictions. The predictions were done after training the classifier on CORE and E2 domains (left), NS3 and NS5A domains (middle), and all four antigens (right).

