
FIGURE 12.
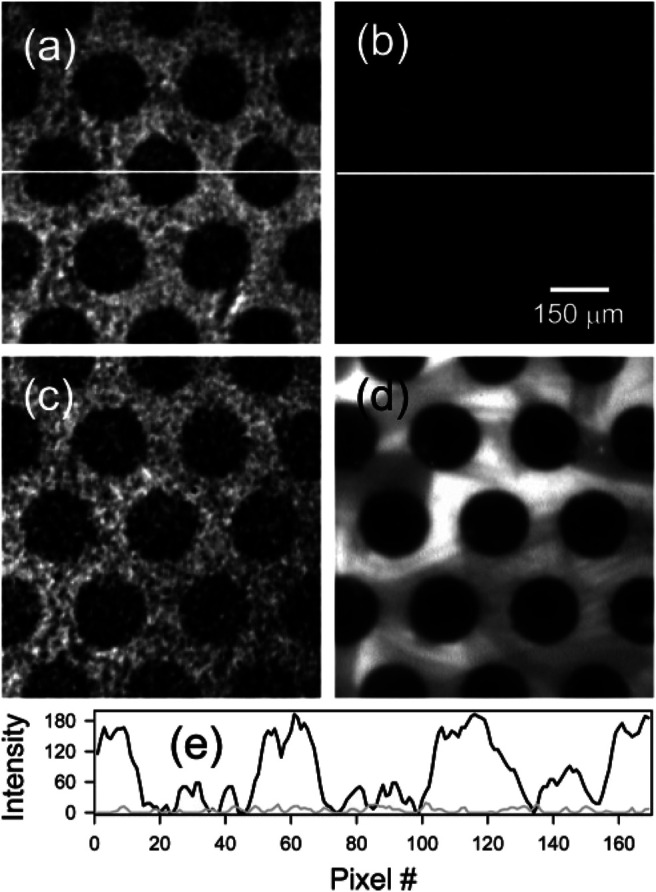
μCP POPC PSLB imaged with C-SHG using (A) RBN, (B) a racemic mixture of RBN and SBN, and (C) SBN. A different bilayer was also imaged with Rh-DOPE using fluorescence microscopy (D). Line scans through the center of image a (black) and b (gray) are shown in part (E). The figure and caption have been adapted with permission from Kriech and Conboy, (2005a), Copyright © 2005 American Chemical Society.