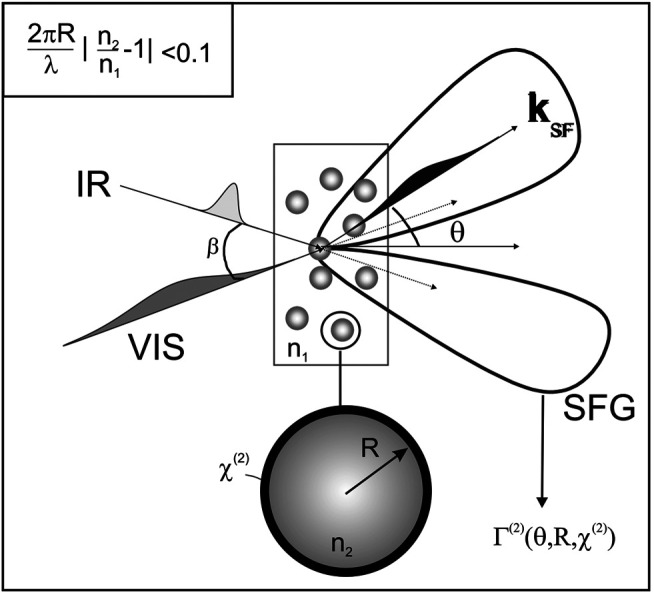
FIGURE 14.

Illustration of a second-order vibrational sum-frequency scattering experiment. The incoming beams generate a nonlinear optical polarization at the interface of a particle. The polarization is the source of the scattered sum frequency light. The magnitude (represented by the scattering lobes) and spectral shape of the scattered field are determined by the molecular properties of the interface, which are contained in the second-order nonlinear susceptibility χ (2). The angular distribution reflects both the value of the second-order susceptibility and the radius of the particle and the scattering geometry. The criterium used in the Rayleigh–Gans–Debye formalism is depicted in the upper left corner. n 1 and n 2 are corresponding refractive indices. The figure and caption have been adapted with permission from de Beer and Roke, (2007), Copyright © 2007 The American Physical Society.
