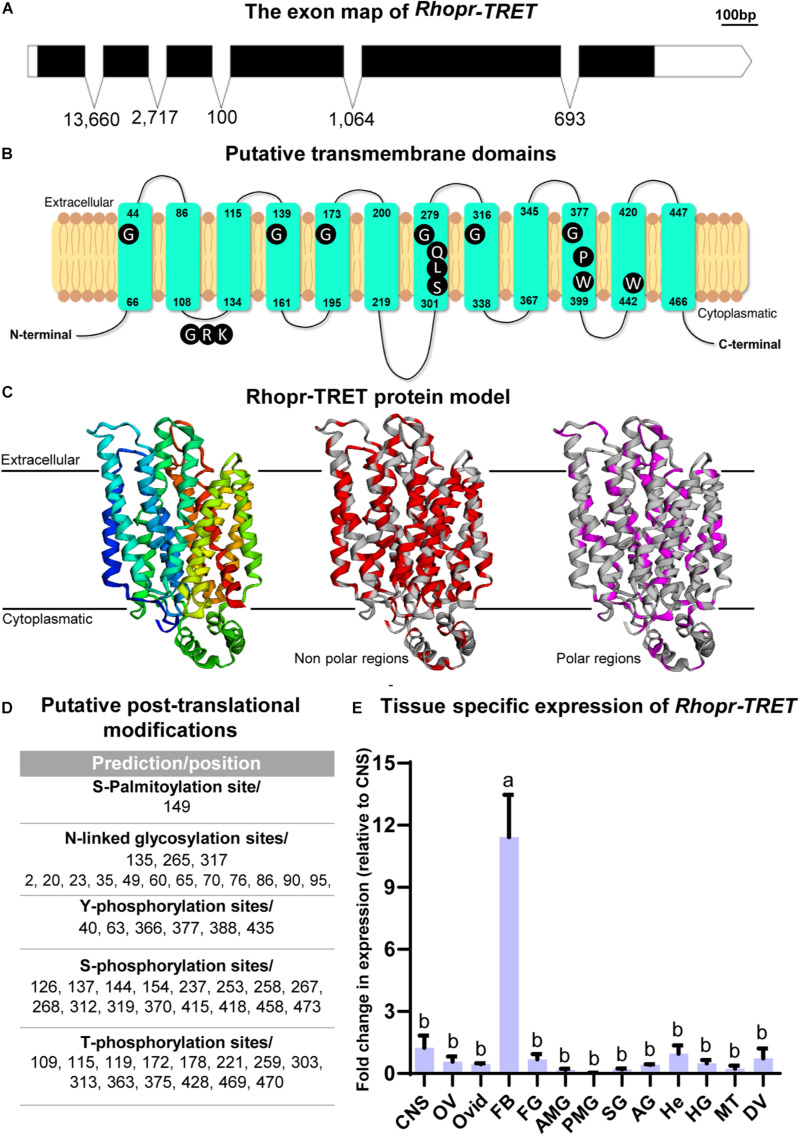
FIGURE 2.
Rhopr-TRET characterization and modeling. (A) Exon map of Rhopr-TRET of the open reading frame (ORF) and exons/introns. The ORF of Rhopr-TRET is denoted by the solid black box spanning the exons. The length of each box is representative of the nucleotide number (bar = 100 bp) and the numbers below represent the intron length as base pairs (bp). (B) Schematic diagram of Rhopr-TRET. The 12 transmembrane domains within the cell membrane and the position of the amino acids indicating the start and end of each transmembrane regions are shown. Conserved motifs among Rhopr-TRET sequences are highlighted in dark in their typical positions. (C) Molecular model of Rhopr-TRET. Cartoon representation of Rhopr-TRET illustrating the folds of the transporter; the putative non-polar and polar regions are also displayed. (D) Putative post-translational modifications, including N-glycosylation, phosphorylation and palmitoylation sites. (E) Distribution of Rhopr-TRET transcript in unfed adult female R. prolixus; central nervous system (CNS), ovaries (OV), oviducts (Ovid), fat body (FB), foregut (FG), anterior midgut (AMG), posterior midgut (PMG), salivary glands (SG), accessory glands (AG) (spermatheca and cement gland), hemocytes (He), hindgut (HG), Malpighian tubules (MT) and dorsal vessel (DV). The expression of transcripts in each tissue was quantified by RT-qPCR. The y-axis represents the fold change in expression relative to CNS (value ∼ 1). The results are shown as the mean ± SEM (n = 3–4, where each n represents a pool of tissues from 3 insects). Statistically significant differences were determined by a one-way ANOVA and a Tukey’s test as the post hoc test. Different letters indicate significant difference at P < 0.05.

