FIGURE 4.
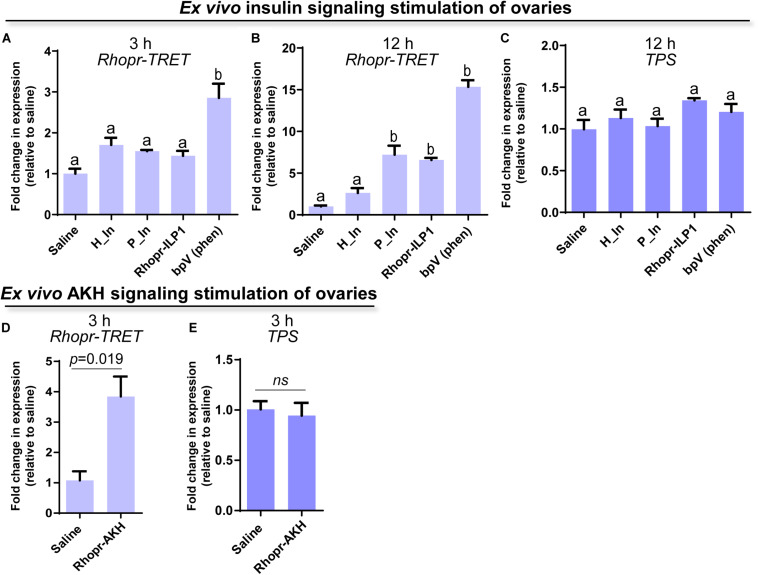
Participation of insulin and AKH signaling in Rhopr-TRET mRNA expression using ex vivo assays. Ovaries from unfed adult females were incubated with human insulin (H_In), porcine insulin (P_In), R. prolixus ILP1 (Rhopr-ILP1), bpV (phen) or R. prolixus AKH (Rhopr-AKH). A control group of ovaries was incubated with only R. prolixus saline (saline). The effects of these stimulators on Rhopr-TRET and TPS transcript expression were tested by RT-qPCR. The y-axis represents the fold change in expression relative to control (saline, value ∼ 1). (A) Rhopr-TRET transcript expression after incubation with the insulin signaling activators for 3 h and (B) 12 h. (C) TPS transcript expression after incubation with the insulin signaling activators for 3 h. (D) Rhopr-TRET transcript expression after incubation with Rhopr-AKH for 3 h. (E) TPS transcript expression after incubation with Rhopr-AKH for 3 h. The results are shown as the mean ± SEM (n = 3–4, where each n represents a pool of tissues from 2 insects). For (A–C), statistically significant differences were determined by one-way ANOVA and Tukey’s test as post hoc test (different letters indicate significant difference at P < 0.05), and for (D,E) a Student’s t-test was used.

