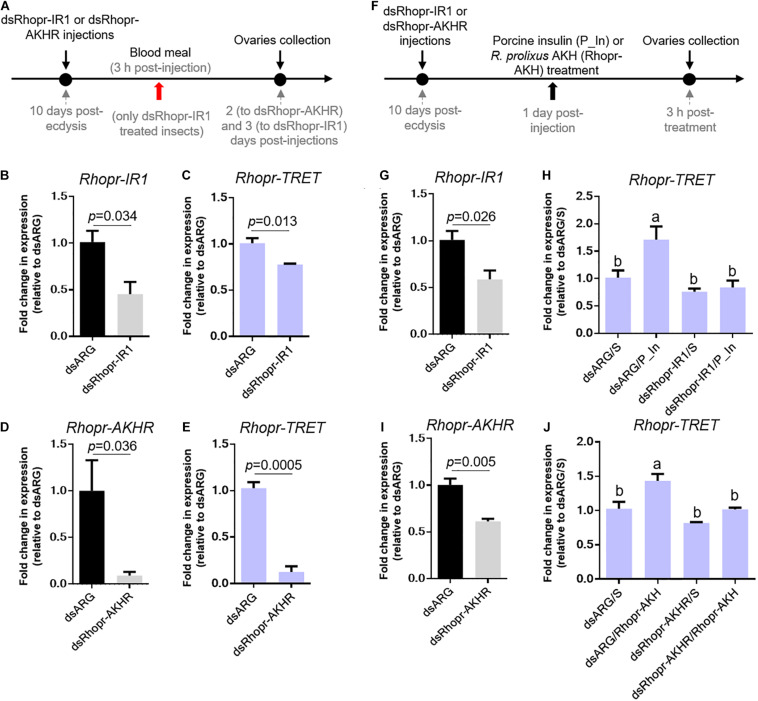
FIGURE 6.
Effect of dsRNA treatment on Rhopr-TRET mRNA expression. (A) Experimental scheme for (B–E). Panels (B,D) show the knockdown efficiency of dsRhopr-IR1 and dsRhopr-AKHR treatments, respectively. Panels (C,E) show the effects of down-regulation of Rhopr-IR1 and Rhopr-AKHR transcripts on Rhopr-TRET expression. (F) Experimental scheme for (G–J). Panels (G,I) show the knockdown efficiency of dsRhopr-IR1 and dsRhopr-AKHR treatments, respectively. Panels (H,J) show the effects of down-regulation of Rhopr-IR1 and Rhopr-AKHR transcripts on Rhopr-TRET mRNA expression following P_In (H), Rhopr-AKH (J) or saline stimulation. Transcript expression was tested by RT-qPCR. The y-axis represents the fold change in expression relative to dsARG injection after saline treatment (dsARG/S, value ∼ 1) obtained viageometric averaging using 18S ribosomal RNA subunit and β-actin as reference genes. The results are shown as the mean ± SEM (n = 4–5, where each n represents an individual tissue from 1 insect). Statistically significant differences were determined by Student’s t-test in all graphs except for (H,J) in which a one-way ANOVA and Tukey’s test as post hoc test was used (different letters indicate significant difference at P < 0.05). dsARG/S: dsARG insects with saline injection; dsARG/P_In: dsARG insects with porcine insulin injection: dsARG/Rhopr-AKH: dsARG insects with Rhopr-AKH injection; dsRhopr-IR1/S: dsRhopr/IR1 insects with saline injection; dsRhopr-IR1/P_In: dsRhopr-IR1 insects with porcine insulin injection; dsRhopr-AKHR/S: dsRhopr-AKHR insects with saline injection; dsRhopr-AKHR/Rhopr-AKH: dsRhopr-AKHR insects with Rhopr-AKH injection.

