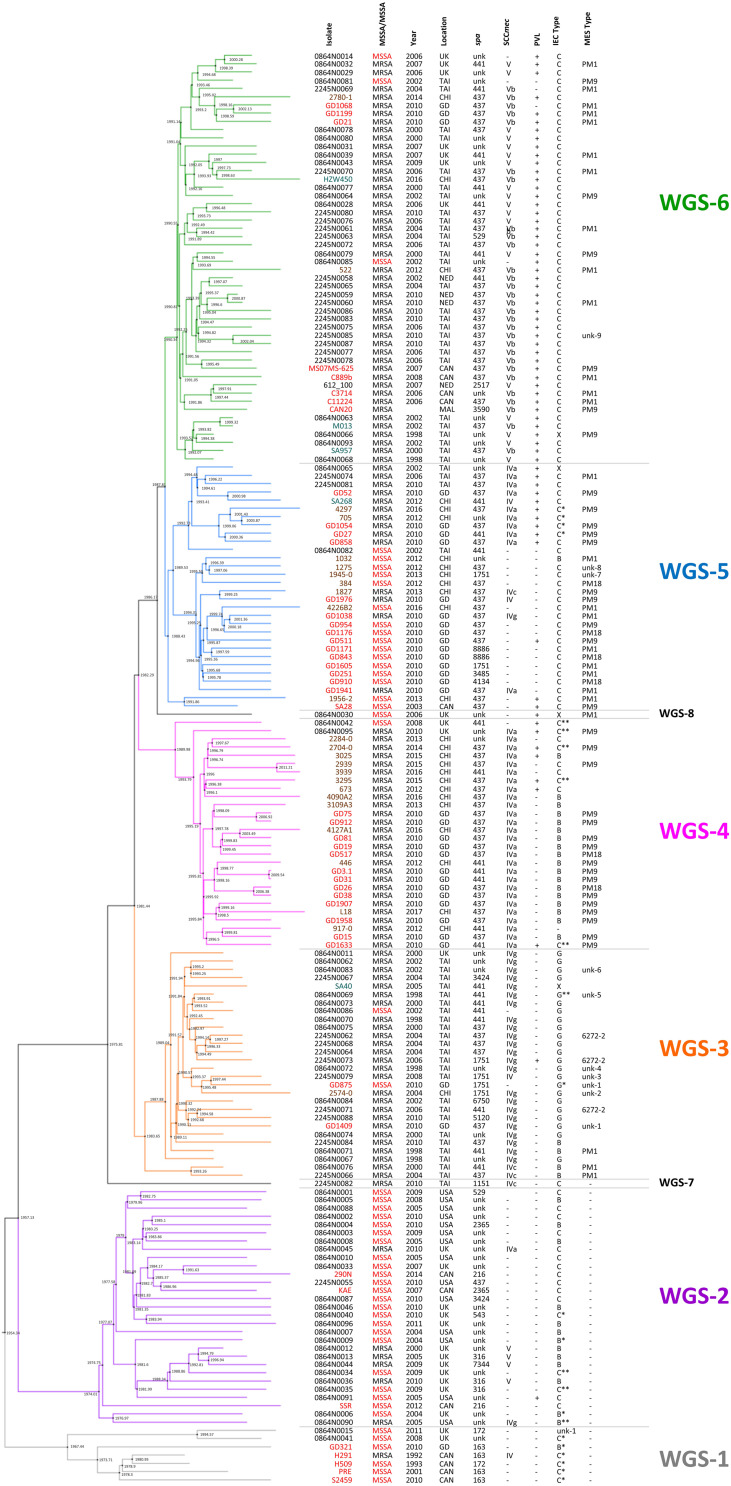
FIGURE 1.
Maximum clade credibility tree showing the phylogenetic relationship between our ST59 isolates, along with global isolates from studies by Ward et al. (2016) and Pang et al. (2020). Branch colors represent the 6 sub-lineages, with WGS-1 represented by gray, WGS-2 by purple, WGS-3 by orange, WGS-4 by pink, WGS-5 by blue and WGS-6 by green. Nodes are marked with black circles, with the estimated node date indicated. Isolates from our study are indicated with red font, isolates from Ward et al. by black font, isolates from Pang et al. by brown font, and sequences downloaded from NCBI in teal font. Methicillin resistance (with MSSA indicated with red font), year and country of isolation, spa type, SCCmec type, PVL carriage, IEC type and MES type are indicated for each strain. MRSA, methicillin resistant Staphylococcus aureus; MSSA, methicillin sensitive Staphylococcus aureus; spa, staphylococcal protein A; SCCmec, Staphylococcal cassette chromosome mec; PVL, Panton-Valentine leucocidin; IEC, immune evasion cluster; MES, mobile element structure; CAN, Canada; CHI, China; GD, Guangdong, China; MAL, Malaysia; NED, Netherlands; TAI, Thailand; UK, United Kingdom; USA, United States of America; unk, unknown; +, trait is present; –, trait is absent.

