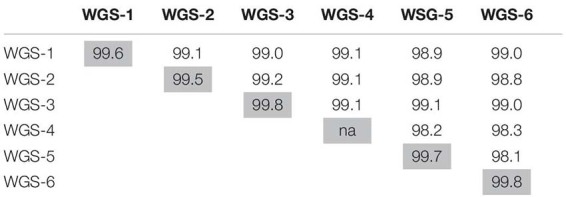
TABLE 3.
In silico genome to genome distance calculations between the most closely related MRSA and MSSA pairs in each sub-lineage, as well as between the most directly descended isolates in each group.
 |
Light gray shading denotes comparisons between the most closely positioned MRSA/MSSA pairs within each sub-lineage: H291/H509 (WGS-1); 0864N0045/0864N0003 (WGS-2); 2245N0079/GD875 (WGS-3); there was not a closely related pair for WGS-4; GD1038/GD954 (WGS-5); 0864N0032/0864N0014 (WGS-6). For comparisons between sub-groups, the following stains were used: 0864N0015 (WGS-1), 0864N0006 (WGS-2), 0864N0076 (WGS-3), 0864N0042 (WGS-4), 1956-2 (WGS-5), and 0864N0068 (WGS-6).
