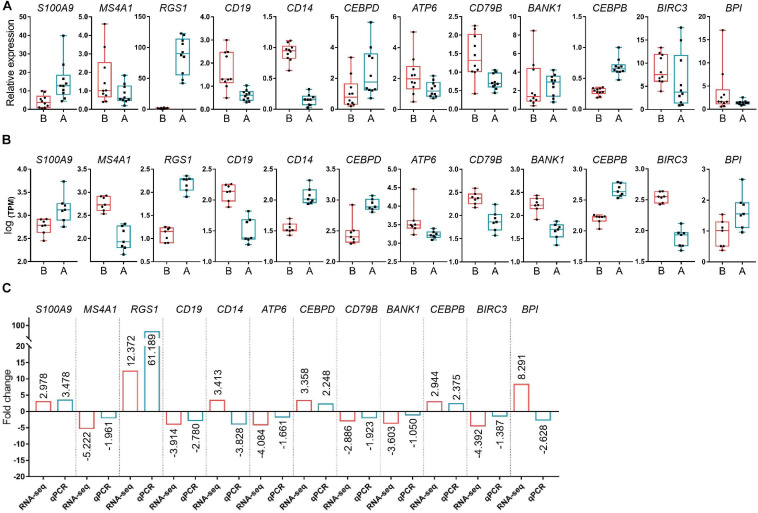
FIGURE 4.
Verification of the differentially expressed genes (DEGs) by PCR. (A) The relative expression levels of the selected DEGs by qPCR. (B) Log [transcript count per million (TPM)] of DEGs by RNA-seq. (C) Fold-change of DEG levels for both Log (TPM) and qPCR. S100A9, S100 calcium binding protein A9; MS4A1, membrane spanning 4-domains A1; RGS1, regulator of G protein signaling 1; CD19, CD19 molecule; CD14, CD14 molecule; CEBPD, CCAAT enhancer binding protein delta; ATP6, ATP synthase F0 subunit 6; CD79B, CD79b molecule; BANK1, B cell scaffold protein with ankyrin repeats 1; CEBPB, CCAAT enhancer binding protein beta; BIRC3, baculoviral IAP repeat containing 3; BPI, bactericidal permeability increasing protein; ACTB, actin beta.

