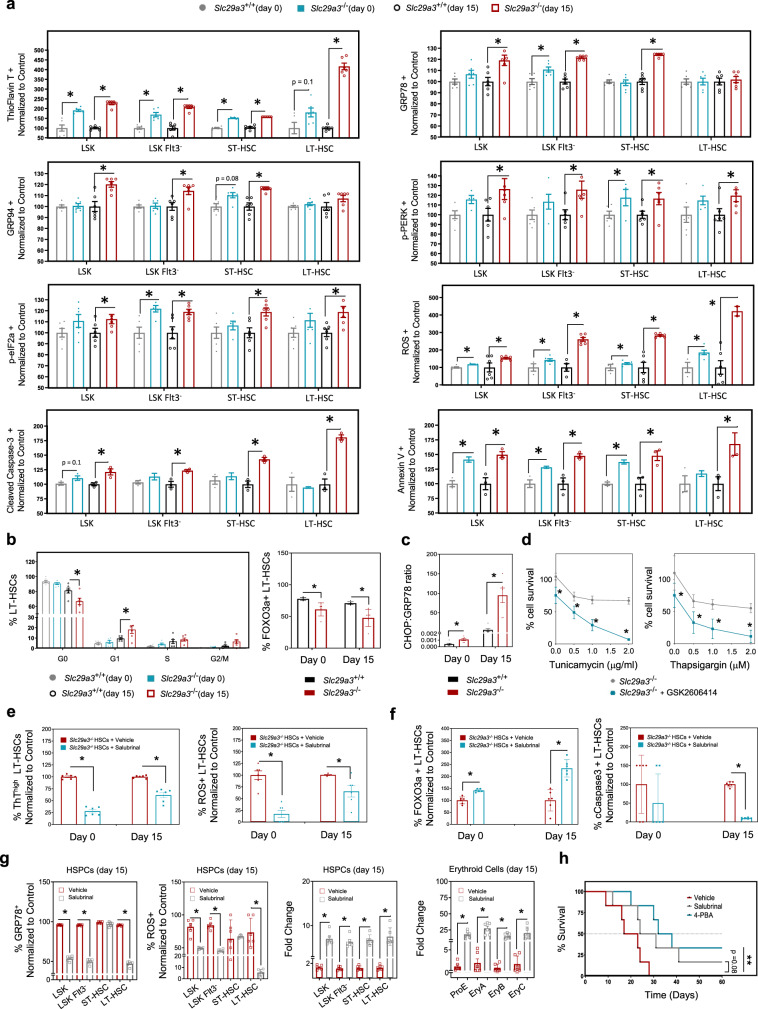
Fig. 2. Anemia in Slc29a3−/− mice is associated with elevated basal ER stress and apoptosis in HSPCs.
a LSK, LSK Flt3-, ST-HSCs, and LT-HSCs were examined for the aggresomal marker Thioflavin T (TFT), ER stress markers (GRP78, GRP94, p-PERK, and p-eI2Fα), reactive oxygen species (ROS), and apoptotic markers (annexin V, and cleaved caspase-3) in 12-week-old Slc29a3+/+ mice pre (day 0) (gray) and post (day 15) (black) irradiation, and Slc29a3−/− mice pre (day 0) (blue) and post (day 15) (red) irradiation. Data represent mean ± SEM normalized to Slc29a3+/+ pre (day 0) and post (day 15) irradiation (n = 6 mice/group, except cleaved caspase 3 and annexin V n = 3 mice/group, *p < 0.05 by ANOVA and Tukey’s post hoc test). b The proportion of LT-HSCs in quiescence (G0) or expressing FOXO3a in 8-week-old Slc29a3+/+ mice pre (day 0) (gray) and post (day 15) (black) irradiation, and Slc29a3−/− mice pre (day 0) (blue) and post (day 15) (red) irradiation. Data represent mean ± SEM (n = 6 mice/group, *p < 0.05 by two-tailed t-test). c CHOP/GRP78 ratio in LT-HSCs in 8-week-old Slc29a3+/+ (black) and Slc29a3−/− (red) mice pre (day 0) and post (day 15) irradiation. Data represent mean ± SEM (n = 6 mice/group, *p < 0.05 by two-tailed t-test). d Treatment with the PERK inhibitor (GSK2606414, 0.5 mM) (blue) or without (gray) alters cell death in Slc29a3−/− HSPCs in the presence of tunicamycin (0–2 mg/ml) or thapsigargin (0–2 mM). Data represent mean ± SEM (n = 6 mice/group, *p < 0.05 by two-tailed t-test). e A proportion of LT-HSCs exhibiting high Thioflavin T fluorescence (ThThigh) and ROS positivity (ROS+) when cultured in the presence of DMSO (vehicle; red) or salubrinal (10 mM; blue). Data represent mean ± SEM (n = 6, *p < 0.05 by two-tailed t-test). f Proportion of LT-HSCs positive for FOXO3a or cCasp3 when cultured in the presence of DMSO (vehicle; red) or salubrinal (10 mM; blue). Data represent mean ± SEM (n = 6, *p < 0.05 by two-tailed t-test). g Relative number of HSPCs and their subsets positive for GRP78 and ROS in Slc29a3+/+ and Slc29a3−/− bone marrow after 6.5 Gy TBI followed by daily treatment vehicle (DMSO; red) or salubrinal (gray; 1 mg/kg, s.c.) and fold change of HSPCs and erythroid cells after 6.5 Gy TBI followed by daily treatment vehicle (DMSO) (red) or salubrinal (gray) (1 mg/kg, s.c.). Data represent mean ± SEM (n = 6, *p < 0.05 by two-tailed t-test). h Survival curves for 60 days were plotted with the Kaplan–Meier method (n = 6/group, ***p < 0.001; Mantel-Cox test). Vehicle (DMSO; red); Sal salubrinal (1 mg/kg, s.c; gray), 4-PBA 4-phenylbutyrate (10 mg/kg, s.c.; blue).

