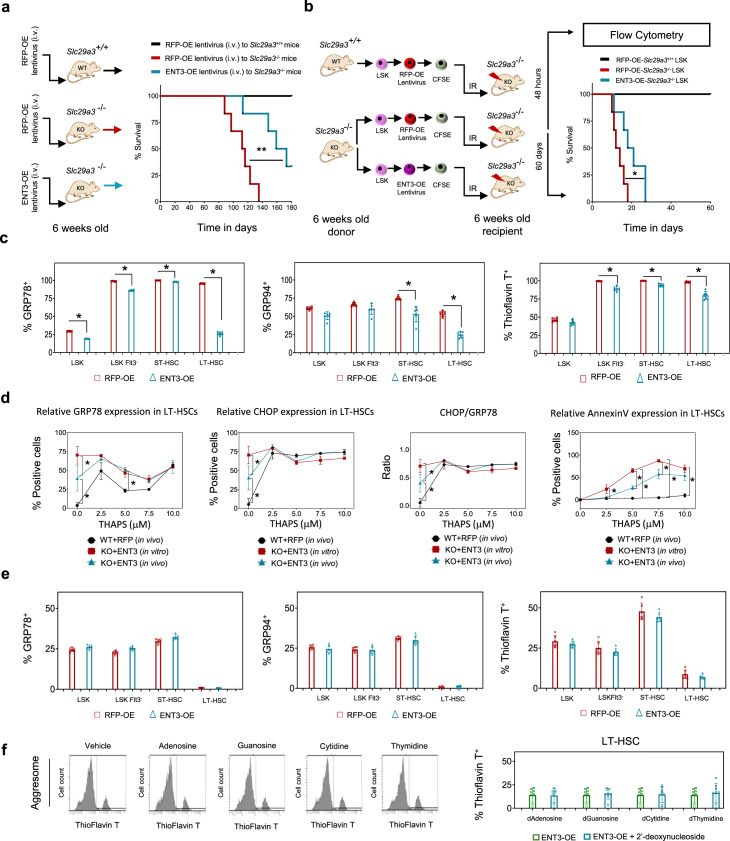
Fig. 3. Ectopic expression of ENT3 in HSPCs ameliorates ER stress when transplanted into irradiated mice.
a Experimental protocol (left) showing lentiviruses (108 TU) overexpressing RFP (RFP-OE) or ENT3 (ENT3-OE) intravenously injected into the tail vein in Slc29a3+/+or Slc29a3−/− mice at 6 weeks of age and monitored for survival. Kaplan–Meier analysis of survival for RFP-OE Slc28a3+/+(black), RFP-OE Slc28a3−/−(red), ENT3-OE Slc28a3−/−(blue) is presented (right) (n = 6/group; **p < 0.01; Mantel-Cox test). b Experimental protocol (left) showing single transplant of Slc29a3−/− LSK cells after lentiviral overexpression of RFP (RFP-OE) or ENT3 (ENT3-OE) in 6.5 Gy irradiated Slc29a3−/− mice. Prior to transplant, all cells are labeled with cell tracker CFSE fluorescent dye. Kaplan–Meier analysis of 60-day survival post-irradiation for RFP-OE Slc28a3+/+ LSK (black), RFP-OE Slc28a3−/− LSK (red), and ENT3-OE Slc28a3−/− LSK (blue) are presented (n = 6/group; *p < 0.001; Mantel-Cox test). c Quantification of positive cells for aggresomes and ER stress markers within each HSPC subpopulation overexpressing RFP (red) or ENT3 (blue) in vivo is presented. Data represent mean ± SEM (n = 6 mice/group, *p < 0.05 by two-tailed t-test). d Flow cytometry quantification of the proportion of LT-HSCs expressing CHOP, GRP78, CHOP/GRP78 ratio, and annexin V after exposure to thapsigargin (0–10 mM) for 3 h and recovery in fresh media for 24 h. CHOP/GRP78 ratio was normalized to relative GRP78 expression. Data represent mean ± SEM (n = 6 mice/group, *p < 0.05 by two-tailed t-test). WT + RFP (in vivo) (black), KO + ENT3 (in vitro) (red), and KO + ENT3 (in vivo) (blue). e Quantification of positive cells for aggresomes and ER stress markers within each HSPC subpopulation overexpressing RFP (red) ENT3 (blue) in vitro is presented. Data represent mean ± SEM. (n = 6 mice/group, statistical comparisons were insignificant by a two-tailed t-test). f Representative flow cytometry plots demonstrating the inability of 2′deoxynucleosides to reverse ER stress in cultured Slc29a3−/− LT-HSCs even after introducing the Slc29a3 gene (ENT3-OE) (left). Quantification results for ENT3-OE (green) and ENT3-OE + 2′-deoxynucleoside (blue) are shown (right). Data represent mean ± SEM. (n = 6 mice/group, statistical comparisons were insignificant by a two-tailed t-test).

