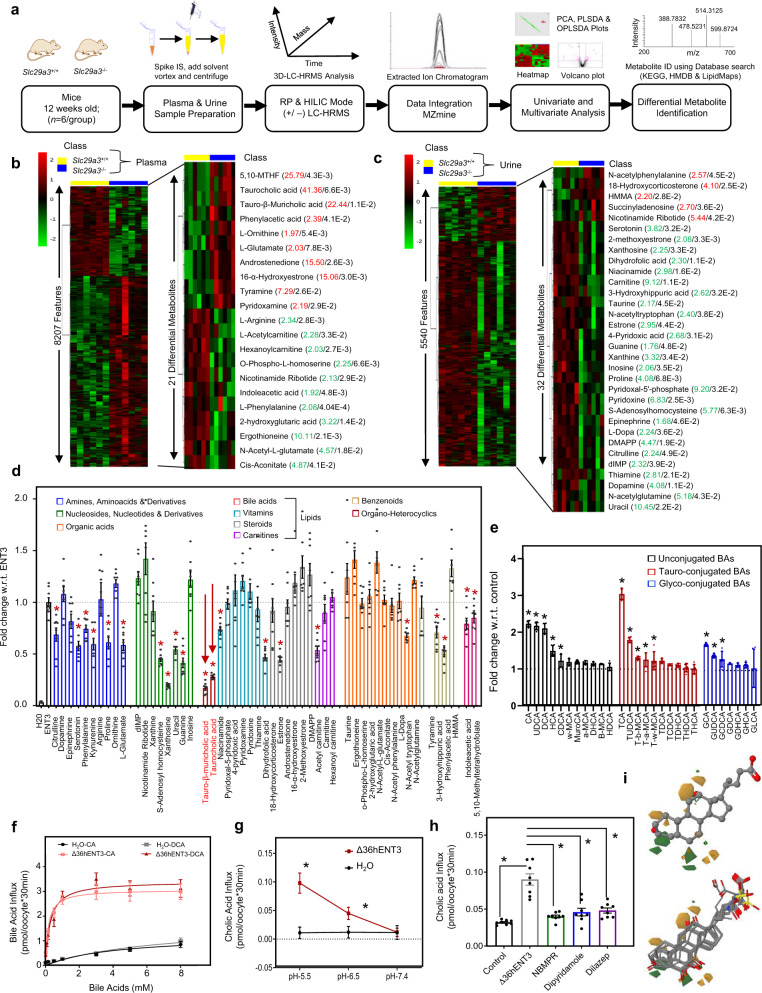
Fig. 4. Untargeted metabolomics and transport analyses identify ENT3 as a facilitative transporter of bile acids.
a Schematic workflow used to profile the plasma and urine metabolome of Slc29a3+/+ and Slc29a3−/− mice. b, c Heat maps illustrating hierarchical clustering of differential features and metabolites detected across 6 Slc29a3+/+ (yellow) and Slc29a3−/− (blue) mice plasma (left), and urine (right) samples by mass spectrometry-based metabolomics. MS signal intensities were clustered in two dimensions on the basis of Euclidean distance (row, metabolites; column, samples). Colors indicate the metabolite abundances (red, high; green, low). For identified metabolites, increased (red) or decreased (green) fold change in Slc29a3−/− and corresponding p-value (black) indicated. d Inhibition of [3H]adenosine uptake at pH 5.5 in oocytes expressing del36hENT3 in the presence of differentially produced metabolites (100 µM). Colors indicate class of substrates, with red arrows highlighting bile acids. Data show the average ± SEM (n = 8 oocytes). *p < 0.05 (one-way analysis of variance compared with transport in uninhibited condition). e Fold increase in the transport of unconjugated BAs (black), tauro-conjugated BAs (red), and glyco-conjugated BAs (blue) (0.02 µM) in oocytes expressing del36hENT3 at pH 5.5 compared with water-injected oocytes. Transport was conducted in sodium-free transport buffer, and flux measurements were made using LC-MS/MS analyses. Data show the average ± SEM (n = 5 oocytes). *p < 0.05 (one-way analysis of variance compared with water-injected oocytes). f Concentration-dependent uptake of [3H]cholic acid (CA) (light red) and [3H]deoxycholic acid (DCA) (dark red) in oocytes expressing del36hENT3 at pH 5.5. Data show the average ± SEM (n = 12 oocytes). g pH-dependent transport of [3H]CA in del36hENT3 expressing oocytes (red), compared to H2O (black). Uptake of [3H]CA (0.02 μm) into oocytes was measured in transport solutions buffered to different pH. Data show the average ± SEM (n = 8 oocytes/group, *p < 0.05 by ANOVA and Tukey’s post hoc test). h [3H]CA uptake into Δ36hENT3 expressing was inhibited by NBMPR, dipyridamole, and dilazep at 10 µM. Data show the average ±SEM (n = 8 oocytes *p < 0.05 by ANOVA and Tukey’s post hoc test). i Contour representation of the key features from a CoMFA analysis of the 21 bile acids that showed any transport activity. Orange solids indicate regions where it is favorable to place steric functional groups, while green solids where it would be unfavorable. Orange wireframes indicate regions where it is favorable to place positive charges, while green wireframes where it would be unfavorable. The chemical structure of cholic acid (top) and alignment of 21 different BAs (bottom) are presented.

