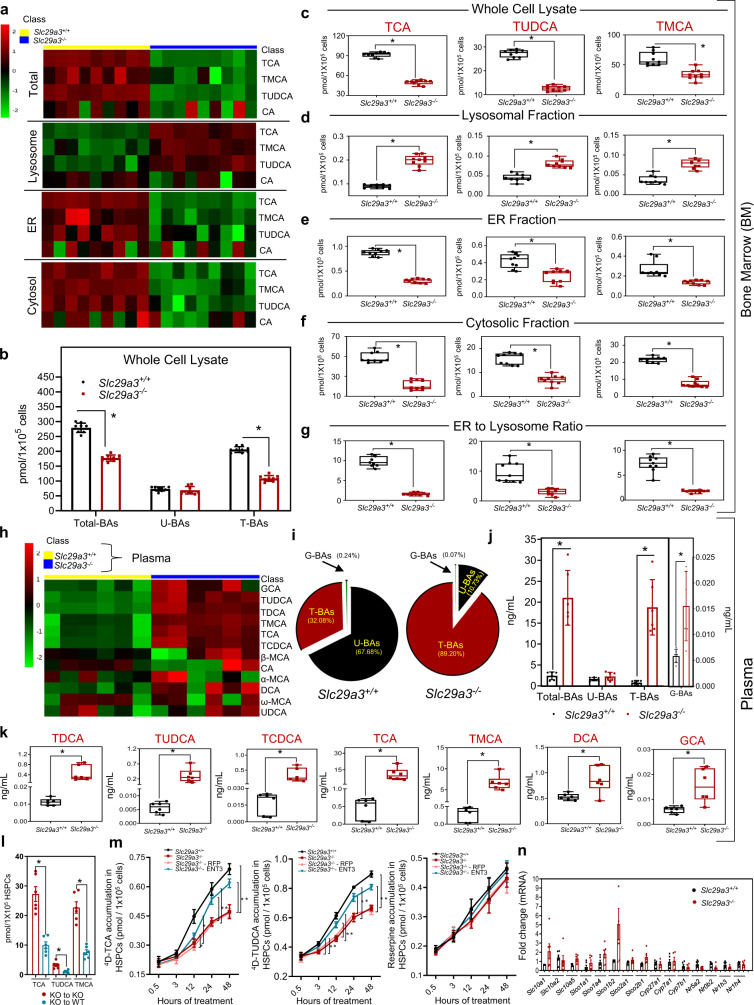
Fig. 5. Targeted analysis of BA disposition in Slc29a3+/+ and Slc29a3−/− mice.
a Heat maps constructed for differentially identified BA as determined by targeted mass spectrometric analysis of total, cytosolic, ER, and lysosomal fractions from Slc29a3+/+ (yellow) and Slc29a3−/− (blue) mice (12 weeks) bone marrow cells, respectively (n = 9 mice/group). MS signal intensities were clustered in two dimensions (row, metabolites; column, samples) on the basis of Euclidean distance. Colors indicate the metabolite abundances (red, high; green, low). b The concentrations of plasma total BAs, unconjugated BAs (U-BAs), taurine-conjugated BAs (T-BAs), and glycine-conjugated (G-BAs) in Slc29a3+/+ (black) and Slc29a3−/− (red) mice bone marrow cells (whole cell lysate) as determined by LC-MS/MS analyses. Data represent mean ± SEM (n = 9 mice/group, *p < 0.05 by two-tailed t-test). c–f Box-whisker plot representation of alterations in BA levels in total, lysosomal, ER, and cytosolic fractions prepared from Slc29a3+/+ (black) and Slc29a3−/− (red) mice bone marrow cells, respectively. Data represent mean ± SEM (n = 9 mice/group, *p < 0.05 by two-tailed t-test). g Box-whisker plot representation of estimated alterations in ER to lysosome ratio of BA levels in Slc29a3+/+ (black) and Slc29a3−/− (red) mice bone marrow cells. Data represent mean ± SEM (n = 9 mice/group, *p < 0.05 by two-tailed t-test). h Heat map representing hierarchical clustering of differentially identified BA as determined by targeted mass spectrometric analysis of Slc29a3+/+ (yellow) and Slc29a3−/− (blue) (12 weeks) mouse plasma (n = 6 mice/group). MS signal intensities were clustered in two dimensions (row, metabolites; column, samples) on the basis of Euclidean distance. Colors indicate the metabolite abundances (red, high; green, low). i, j Pie chart and bar graph representation of changes in total, unconjugated (U-BA) and taurine- (T-BA) and glycine- (G-BA) conjugated BAs in Slc29a3+/+ and Slc29a3−/− mice plasma samples. Data represent mean ± SEM (n = 6 mice/group, *p < 0.05 by two-tailed t-test). k Box-whisker plot representation of significantly altered BAs in Slc29a3+/+ (black) and Slc29a3−/− (red) mice plasma as determined by targeted LC-MS/MS analyses. Data represent mean ± SEM (n = 6 mice/group, *p < 0.05 by two-tailed t-test). l Cellular content of TCA, TUDCA, and TMCA in the Slc29a3−/− donor-derived (CFSE labeled) HSPCs harvested from irradiated Slc29a3+/+ (blue) or Slc29a3−/− (red) recipient mice at 48 h after transplantation. Data represent mean ± SEM (n = 6 mice/group, *p < 0.05 by two-tailed t-test). m Uptake of 4D (deuterated)-TCA, 4D-TUDCA, and reserpine into Slc29a3+/+ (black), Slc29a3−/− (red), RFP (light red), or ENT3 (blue) expressing Slc29a3−/− HSPCs after 0.5, 3, 12, 24, and 48 h of incubation with the respective 4D-BAs. For L and M, samples were pooled from 5 to 6 mice/group to reach 1 × 10⁵ HSPCs to ensure that analytes were above the lower limit of quantitation in our LC-MS/MS assay. Data represent mean ± SEM (n = 5pooled mouse samples/group, *p < 0.05 by two-tailed t-test). n qPCR analysis of mRNA levels in LT-HSCs for transporters, metabolic enzymes, and nuclear receptors involved in BA homeostasis from Slc29a3+/+ (black) and Slc29a3−/− (red) mice. Data represent mean ± SEM (n = 6 mice/group, Slc29a3+/+; n = 5 mice/group, Slc29a3−/−, statistical comparisons were insignificant by two-tailed t-test. All box plots in this figure represent the median (middle line), 25th, and 75th percentile (box), while the whiskers span from the minimum to the maximum value.

