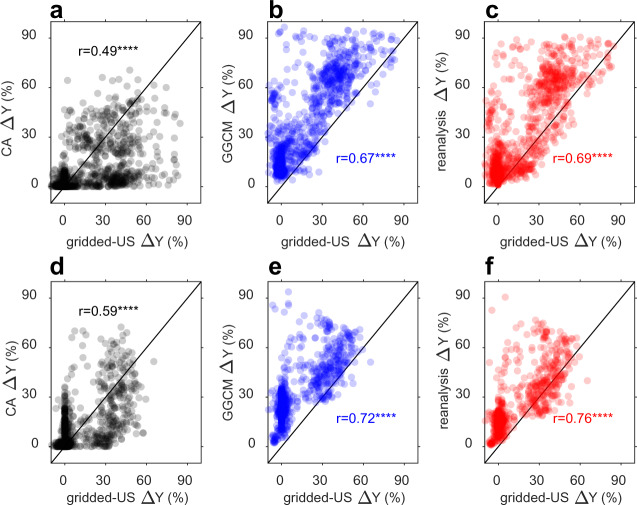
Fig. 1. Comparison of irrigation contribution to yield (ΔY) estimated from statistics over conterminous United States (gridded-US) and from different approaches, for wheat (top panels) and for maize (bottom panels).
a, d ΔY estimated from the climate analogue (CA) approach; b, e ΔY estimated from global gridded crop models (GGCM); c, f ΔY estimated from Bayesian model average (BMA). Details of different datasets and approaches can be found in the Methods section. r indicates Pearson correlation coefficient between ΔY estimated from gridded-US and other ΔY estimates. **** indicates significant (p < 0.01) Pearson correlation (two-tailed tests, no adjustments).

