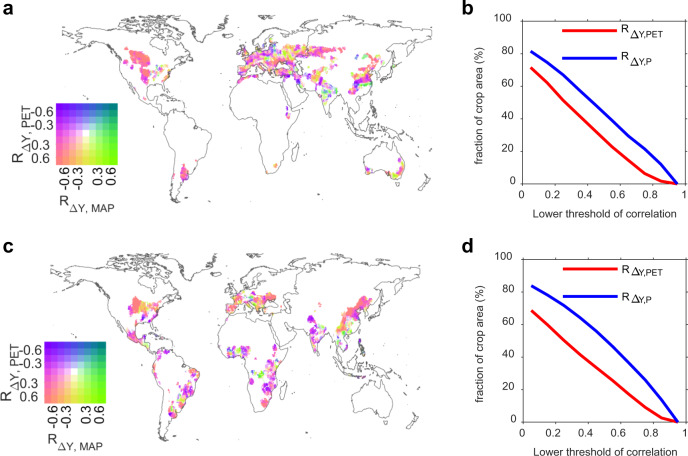
Fig. 3. Partial correlation in the spatial domain between reanalyzed ΔY and climatic variables (potential evapotranspiration (PET) and mean annual precipitation (MAP)) for wheat (top panels) and for maize (bottom panels).
a, c Bivariate mapping for spatial distribution of the partial correlation coefficient between ΔY and PET (RΔY,PET) and that between ΔY and MAP (RΔY,MAP). b, d Percentage of cropland area where ΔY is controlled by PET or precipitation depending on the chosen threshold (x-axis) for the partial correlation coefficients.

