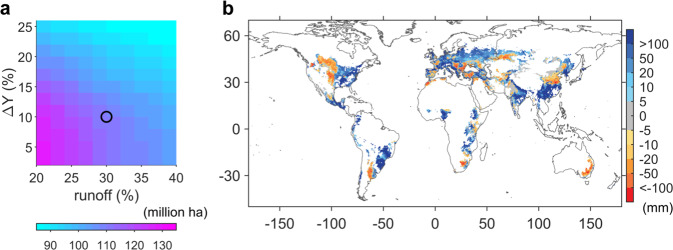
Fig. 4. Relationship between irrigation demand estimated from the reanalysis for contemporary rainfed croplands of wheat and maize and available runoff resources.
a The amount of rainfed crop area when irrigation demand cannot be met with available runoff resources, according to different minimum threshold of ΔY (y-axis) and maximum threshold of runoff consumption (x-axis). b The spatial distribution of the difference between irrigation demand and available runoff resources. The spatial pattern is determined with the minimum threshold of ΔY for demanding irrigation is 10% and the maximum usage of runoff is 30% (corresponding to the black circle in a). See Supplementary Fig. 5 for spatial pattern of different thresholds of maximum runoff usage.

