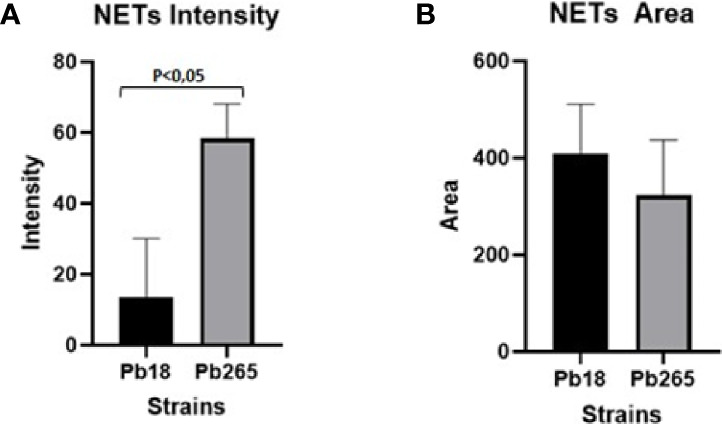
Figure 5.

Analysis of neutrophil extracellular traps (NETs) fluorescence intensity (A) and area (B) by IMARIS software. The total area and intensity of the NETs were analyzed using the images acquired from cultures challenged with Pb18 and Pb265, using the elastase staining. The results are representative of aquired images of 10 individuals analysed.
