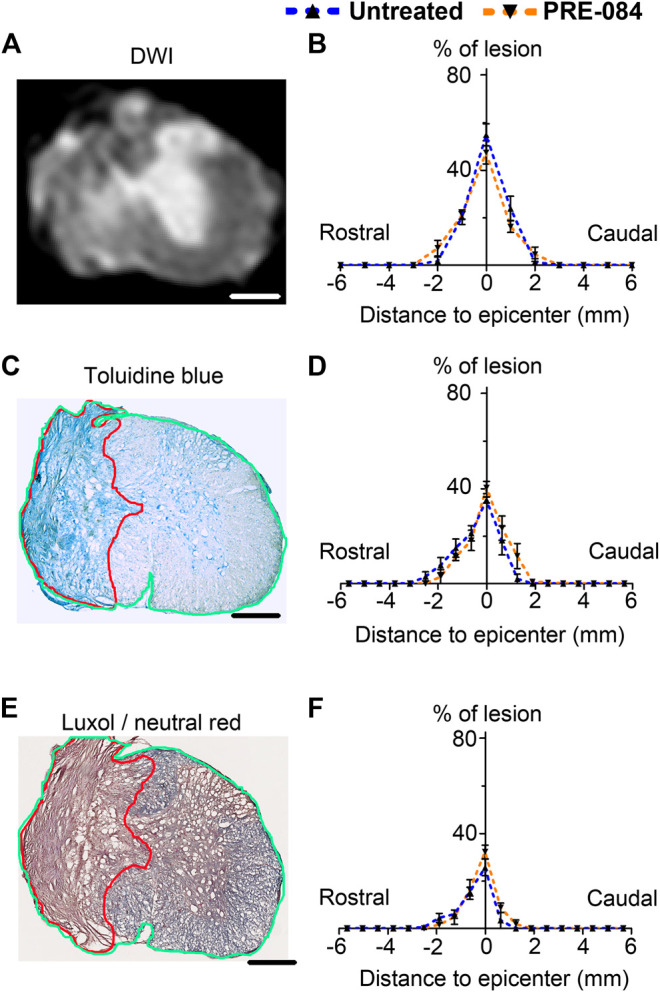
FIGURE 2.

Lesion size analysis. Representative ex vivo diffusion weighted MRI (DWI) (A), toluidine blue staining (C) and luxol fast blue/neutral red staining (E) at lesion epicenter 6 weeks after SCI. Quantifications of the lesion percentage at the epicenter, the lesion extension and the lesion volume represented by area under the curve using DWI acquisitions (B), toluidine blue sections staining (D) and luxol fast blue/neutral red (F) in both treated and untreated injured animals. Note the damaged spinal cord tissue (outlined in red in C and E) used for lesion quantification and allows distinction from undamaged tissue (outlined in green in C and E) Number of hemisected mice: DWI six treated and six untreated and histology five treated and five untreated. Scale bars: A, C and E 600 μm.
