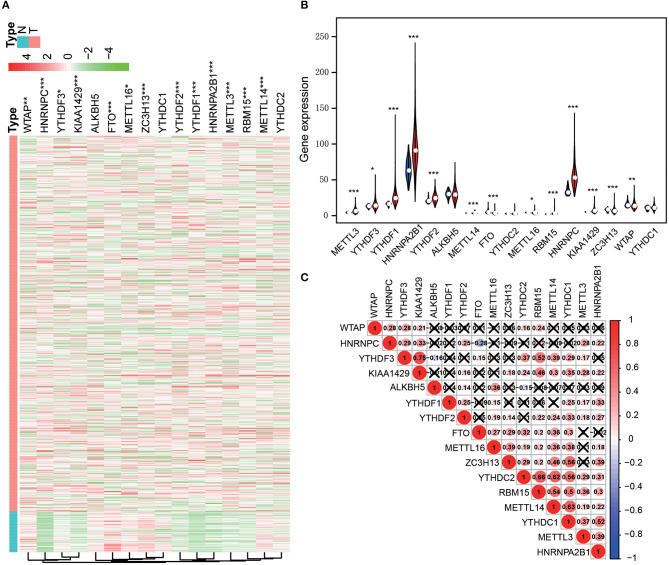
Figure 1.
The 16 m6A-related genes were differentially expressed in the comparison of LUAD with normal tissues. (A) Heatmap (***p < 0.001; **p < 0.01; *p < 0.05; Red means high expression and green means low expression). (B) Violet plots (***p < 0.001; **p < 0.01; *p < 0.05; Blue represents normal tissue and red represents cancer tissue). (C) The correlation between the expression levels of each m6A-related gene.

