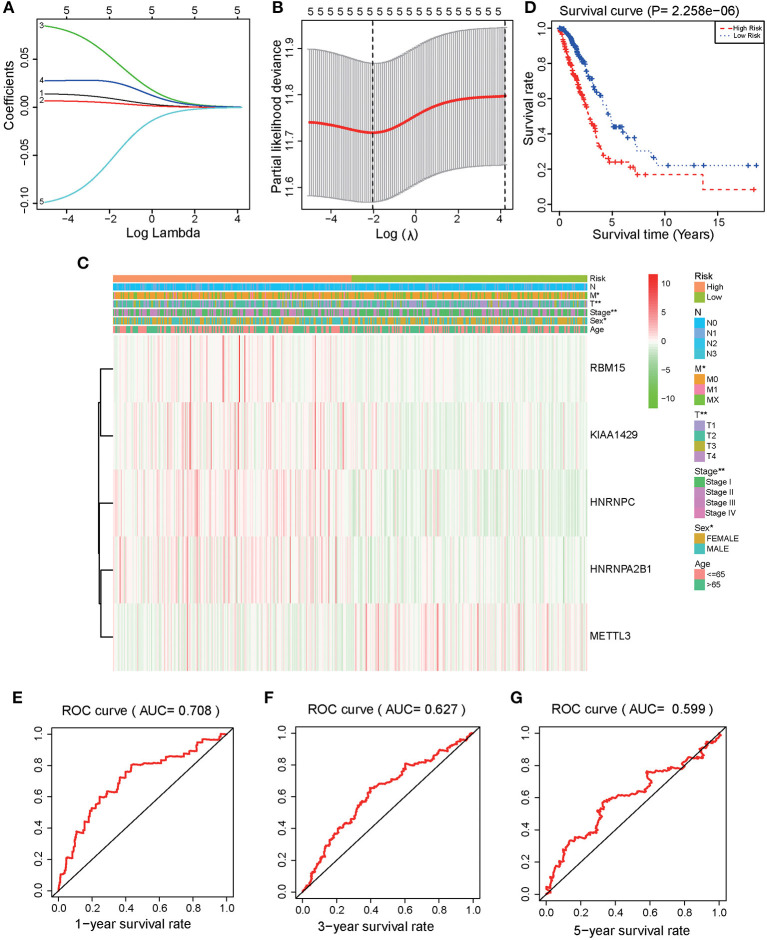
Figure 3.
Identification and validation of a risk model to prognose LUAD patients. (A) The LASSO analysis model was verified by repeated calculation of the 16 m6A genes. (B) LASSO coefficient profiles. (C) According to LASSO risk factors, LUAD patients were divided into high-risk group and low-risk group. Heatmap demonstrated the expression levels of HNRNPA2B1, HNRNPC, KIAA1429, RBM15, and METTL3 in the two assessed groups. (D) Kaplan Meier analysis for the survival of LUAD patients. (E) 1-year (P < 0.001), (F) 3-year (P < 0.001), (G) 5-year OS ROC curves (P < 0.001).

