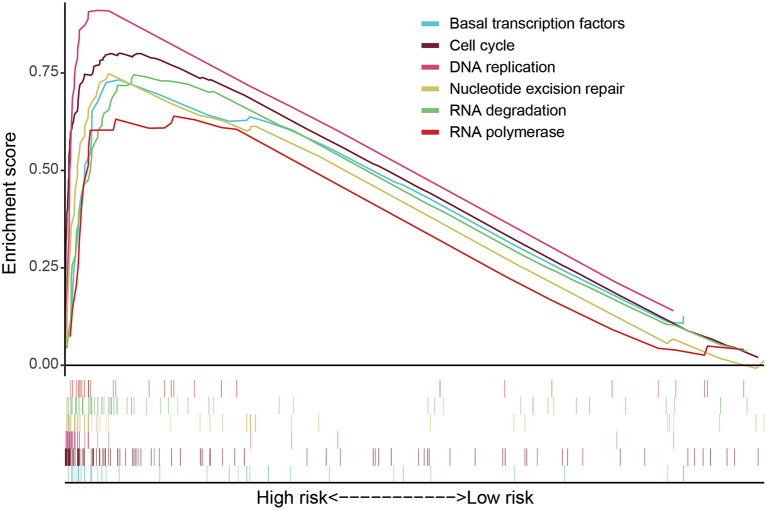
Figure 4.
GSEA software was used to analyze the expression differences of internal signal pathways between the two subgroups, including Cell cycle (P < 0.001, FDR < 0.001, NES = 2.56), DNA replication (P < 0.001, FDR < 0.001, NES = 2.17), RNA degradation (P < 0.001, FDR<0.001, NES = 2.49), RNA polymerase (P = 0.006, FDR = 0.024, NES = 1.85), Nucleotide excision repair (P < 0.001, FDR < 0.001, NES = 2.29), and Basal transcription factors (P < 0.001, FDR < 0.001, NES = 2.29) as well as other related signaling pathways (P < 0.05, FDR < 0.25).

