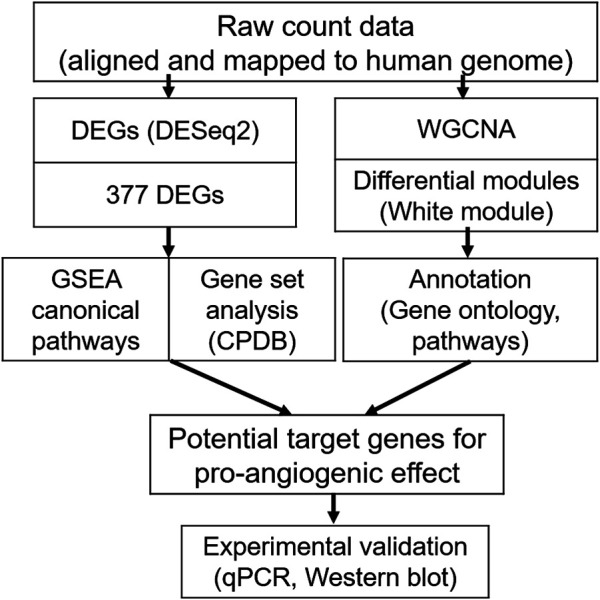
FIGURE 5.

Workflow of the RNA-sequencing (RNA-Seq) analysis for the ginsenoside Rb2/Rg3 combination, compared to the control group. Firstly (left), differentially expressed genes were determined using DESeq2. The 377 differentially expressed genes in the combination-treated group were subject to Gene Set Enrichment Analysis (GSEA) and Consensus Path DB (CPDB) gene set analyses. In parallel (right), Weighted Gene Co-expression Network Analysis (WGCNA) was performed on combination treated vs untreated cells, and the resulting white gene module was subject to Gene Ontology and pathway analysis. Both methods together were used to understand the synergistic effect of the ginsenoside combination treatment on a mechanistic level, and formed the basis of selecting 18 genes for further experimental validation by qPCR and Western blotting.
