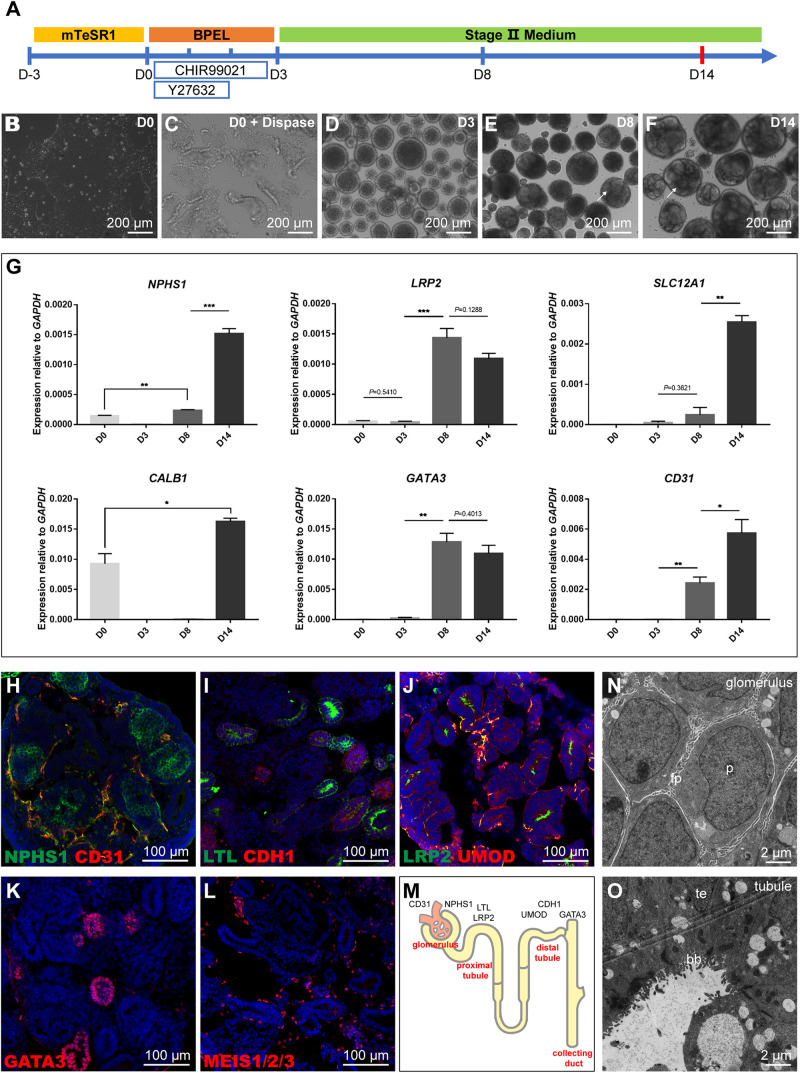
FIGURE 1.
Schematic representation and characterization of the kidney organoid differentiation process. (A) Roadmap of kidney organoids derived from hiPSCs. (B,C) Starting iPSC colonies and iPSC colonies digested by dispase. (D) Embryoid bodies. (E,F) The phenotype of kidney organoids at day 8 (D8) and day 14 (D14); formation of tubules is visible on the surface (arrows). (G) qRT-PCR analysis for selected markers during the differentiation at day 0, 3, 8, and 14. Data are presented as mean ± SEM from biological triplicates. **P < 0.01, ***P < 0.001. (H–L) Immunostaining of frozen sections of day 14 organoids showing NPHS1+ podocytes and CD31+ endothelial cells, LTL+ proximal tubules, and CDH1+ distal tubules, LRP2+ proximal tubules, and UMOD+ thick ascending limb segments, GATA3+ collecting duct structures, and MEIS1/2/3+ interstitial cells. Nuclear counterstain: DAPI. (M) Schematic representation of kidney organoids (day 14). (N,O) Transmission electron micrograph (TEM) images of day 14 organoid sections: podocytes (p, podocytes; fp, primitive foot processes); and tubular (te, tubular epithelium; bb, brush border).

