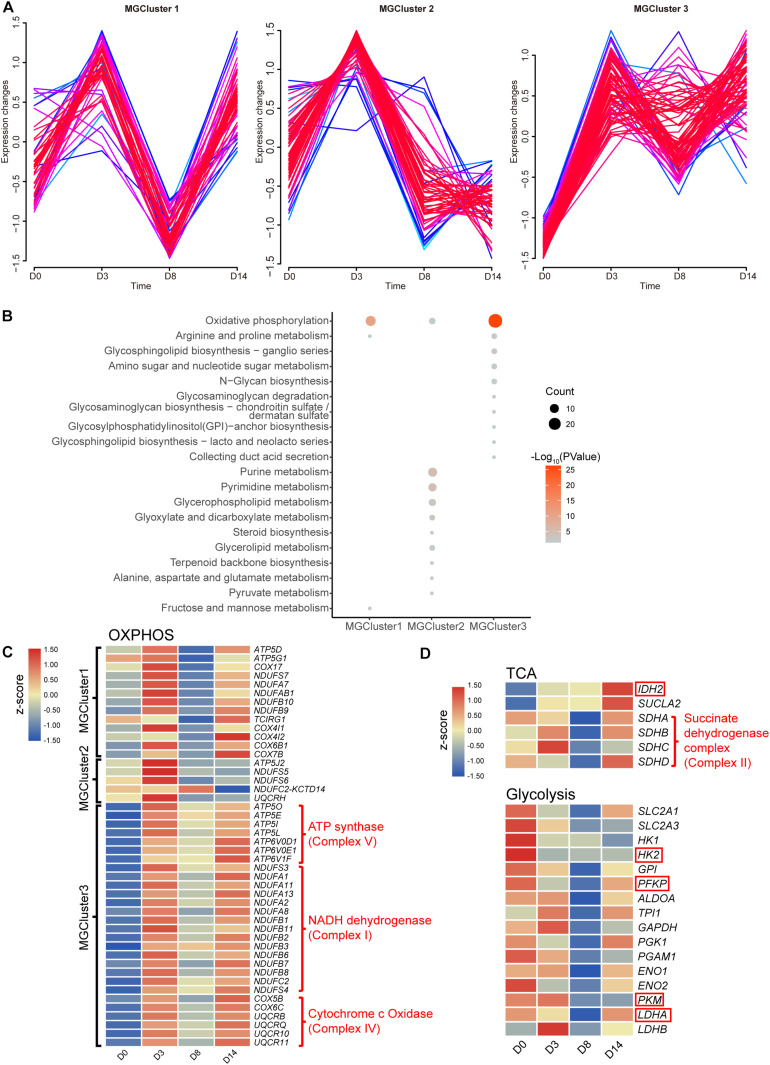
FIGURE 3.
Dynamic changes in metabolite-related genes. (A) Time-course expression profiles of 190 genes enriched in the KEGG term metabolic pathways. (B) KEGG functional analysis of three overrepresented clusters. Pathways with a P-value below 0.05 are shown. (C) Heatmap of relative gene expression related to OXPHOS from three overrepresented clusters. (D) Heatmap of relative gene expression in the TCA cycle related to OXPHOS and in the glycolysis pathway. Genes highlighted in the red frame encoding the rate-limiting enzymes. Heatmap shows averaged values from biological replicates.

