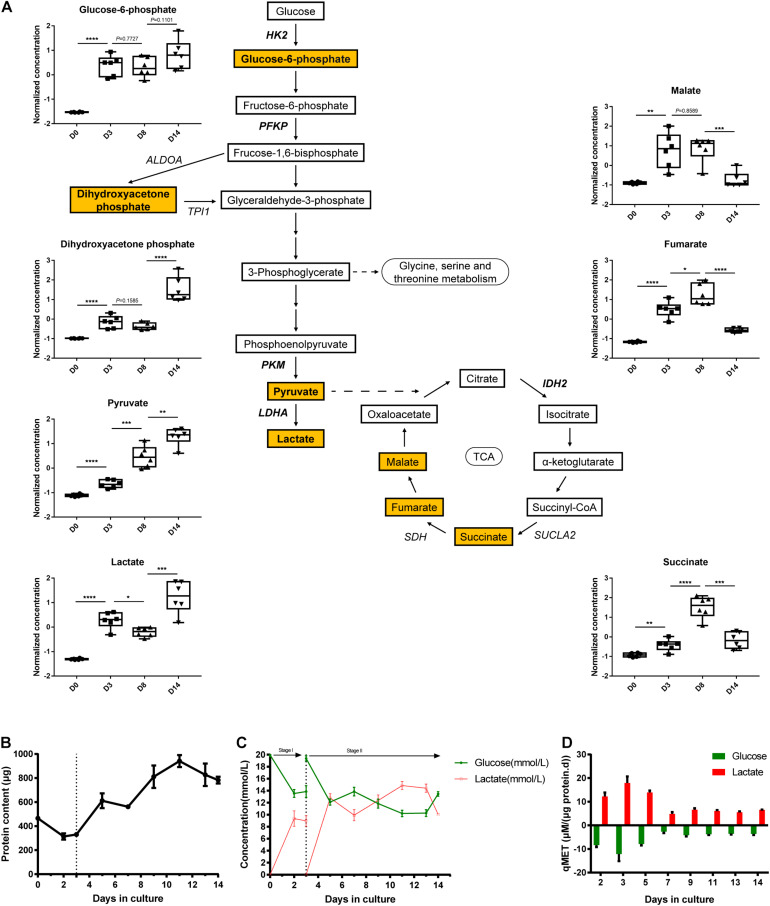
FIGURE 4.
Transcriptional and metabolic changes in glycolysis and TCA cycle. (A) Schematic of the glycolysis pathway and TCA cycle, the normalized and auto-scaled concentration of quantified metabolites are highlighted. (B) The total protein content of cells during the cultivation. (C) Concentration of extracellular residual glucose (green line) and lactate (red line) during differentiation. (D) Specific consumption rates of glucose (green column) and specific generation rate of lactate (red column) at different time points. The normalization of concentration of metabolites is described in methods. Data are presented as mean ± SEM from at least three biological replicates. *P < 0.05, **P < 0.01, ***P < 0.001, and ****P < 0.0001.

