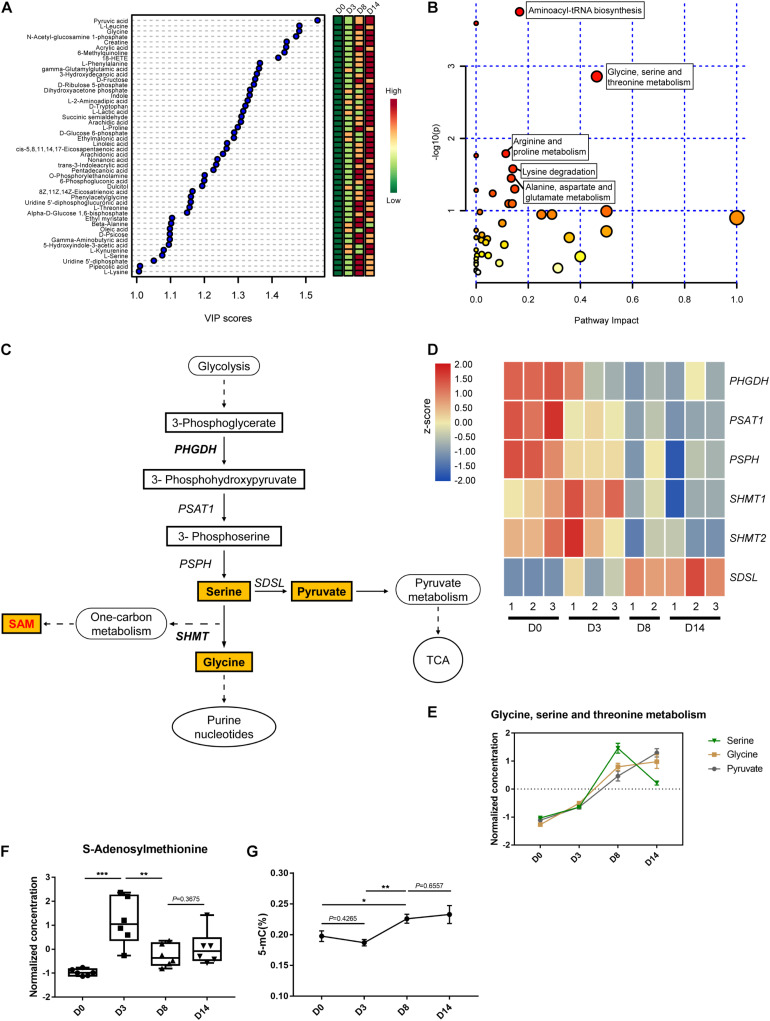
FIGURE 5.
Metabolic profiling of the glycine, serine, and threonine metabolic pathway. (A) Variable importance in projection (VIP) scores of 48 intracellular metabolites above one calculated by the PLS-DA model. Colors represent average concentration from six biological replicates at each time point. (B) Pathway impact analysis (pathways with high P-value and/or high pathway impact are labeled). (C) Schematic of glycine, serine, and threonine metabolic and related pathways. Quantified metabolites are highlighted. (D) Heatmap of the relative expression level of genes related to serine metabolism. (E) The normalized and auto-scaled concentration of measured metabolites in glycine, serine, and threonine metabolism pathway. (F) The normalized and auto-scaled concentration of S-Adenosylmethionine (SAM) in different time points. (G) DNA methylation level during the kidney organoid differentiation process. The normalization of concentration of metabolites is described in methods. Data are presented as mean ± SEM from at least three biological replicates. *P < 0.05, **P < 0.01, and ***P < 0.001.

