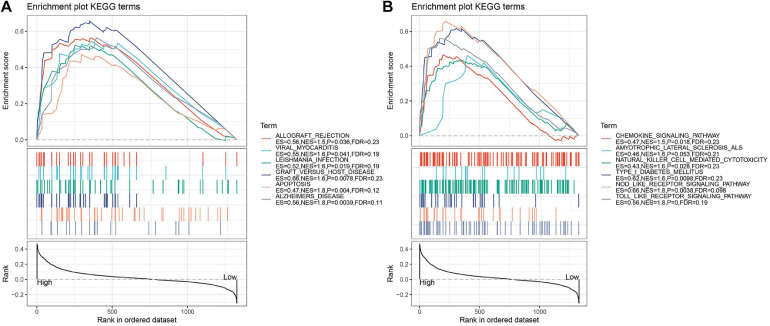
FIGURE 5.
(A,B) GSEA pathways enriched in the low- and high-risk groups according to the immune-related genes. There are too many results of GSEA enrichment, so it is divided into two graphs, panels (A,B). Pathways enriched in the low-risk group. Vertical lines represented the positions of genes belonging to the set of special pathways. Negative enrichment score indicates a higher correlation with individuals in the low-risk group.

