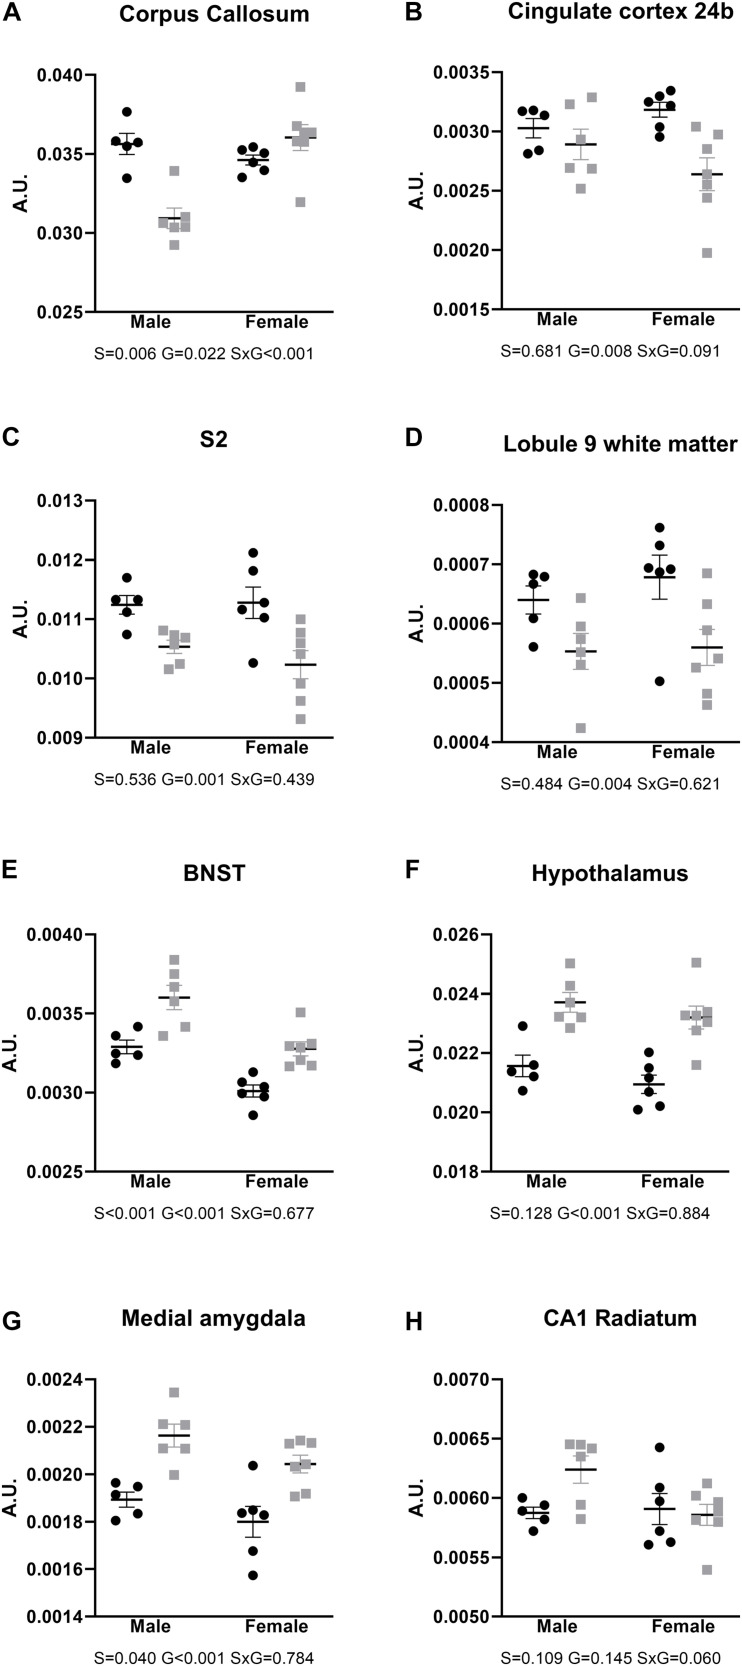
FIGURE 2.
Relative volumes of brain areas and regions, compared with two-way ANOVA. (A–D) Areas with smaller relative brain volumes in the AdKO2.0 mice. (E–G) Areas with bigger relative brain volumes in the AdKO2.0 mice. (H) CA1 s. radiatum as representative for the hippocampus. S2: secondary somatosensory cortex; BNST: bed nucleus of the stria terminalis; CA1: cornu ammonis 1. S, G, and S × G: p value of the source of variation (sex, genotype, and interaction, respectively). Black dots: wild type. Gray squares: AdKO2.0. AU, arbitrary units.

