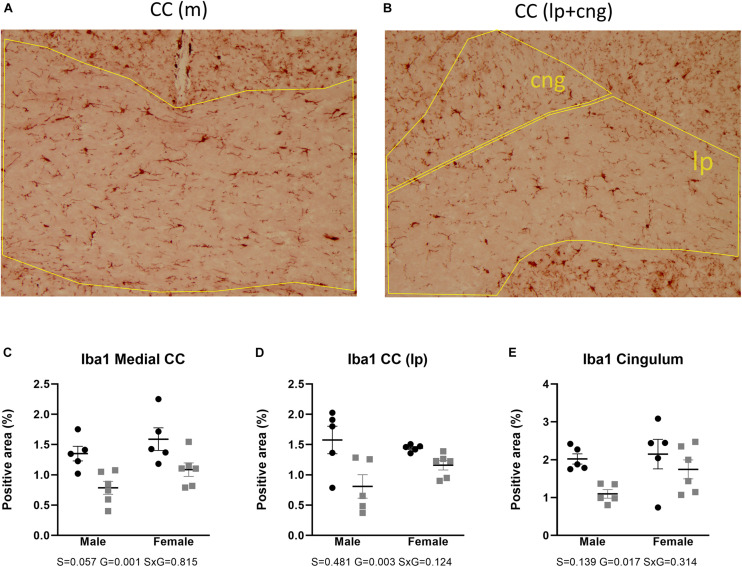
FIGURE 7.
Expression of Iba1 in the corpus callosum (medial and lateroproximal) (A,B). Coded polygons in stained sections indicate neuroanatomical parcellations. In medial and lateroproximal (lp) areas, a decrease in expression in AdKO2.0 mice compared to that in WT mice was observed (C,D). In the cingulum (cng), there was a male-specific decrease in the AdKO2.0 mice (E). S, G, and S × G: p value of the source of variation (sex, genotype, and interaction, respectively). Black dots: wild type. Gray squares: AdKO2.0.

