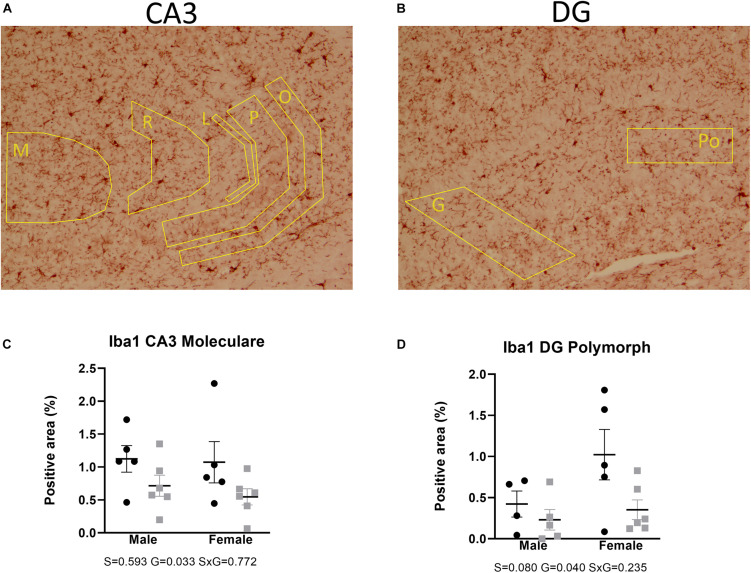
FIGURE 8.
Expression of Iba1 in the hippocampal CA3 (A) and DG (B). Coded polygons in stained sections indicate neuroanatomical parcellations. In the stratum moleculare (M) of CA3, AdKO2.0 of both sexes showed a decrease in expression, compared to WT mice (C). In the polymorph (Po) layer of DG, there is a female-specific decrease in AdKO2.0 mice (D). Data were analyzed by two-way ANOVA, α: 0.05. S, G, and S × G: p value of the source of variation (sex, genotype, and interaction, respectively). Black dots: wild type. Gray squares: AdKO2.0.

