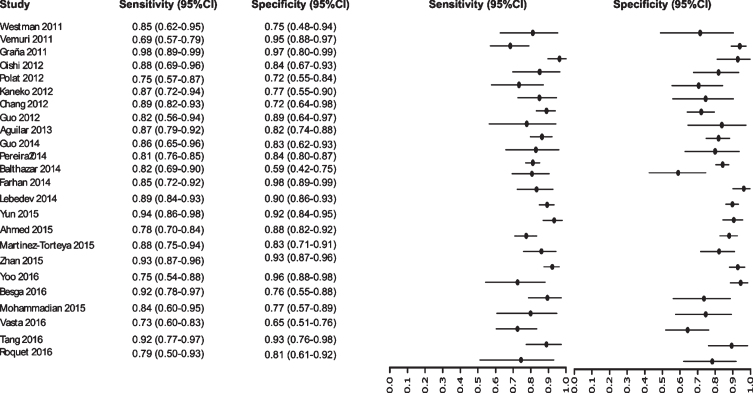
Fig. 7.
Study data and paired forest plot of the sensitivity and specificity of MRI in Alzheimer’s disease diagnosis (from 2011 to 2016). Data from each study are summarized. Sensitivity and specificity are reported with a mean (95% confidence limits). Forest plot depicts the estimated sensitivity and specificity (black circles) and its 95% confidence limits (horizontal black line).

