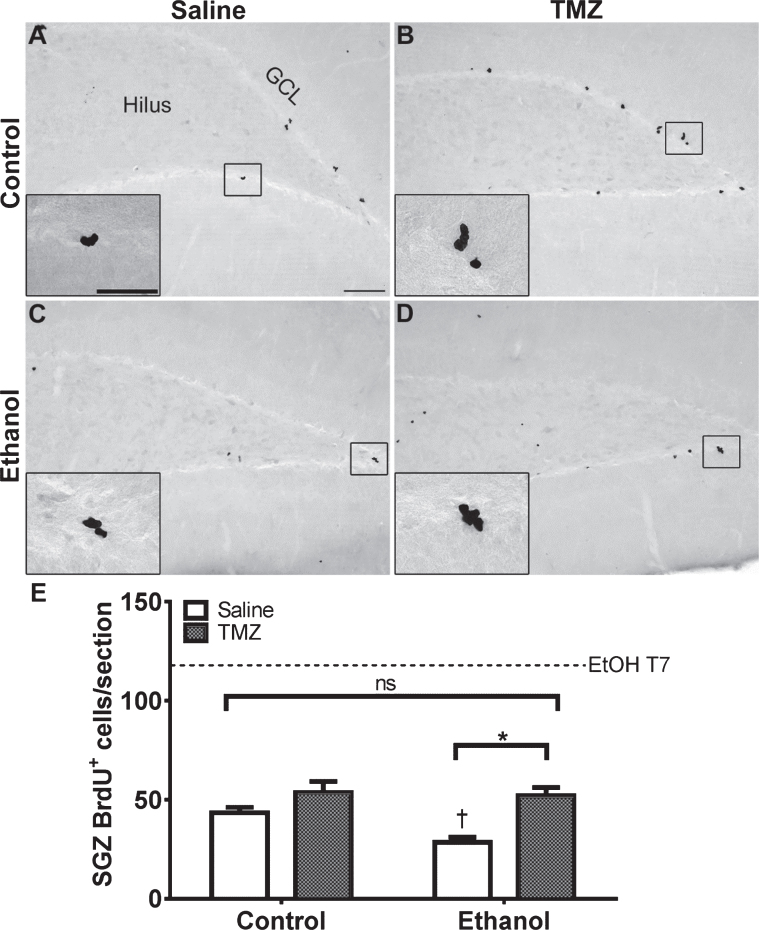
Fig. 5.
TMZ does not merely delay reactive NSC proliferation. (A-D) Representative images of BrdU immunoreactivity at T14 (2 hours after BrdU injection) are shown for (A, B) control and (C, D) EtOH following saline or TMZ (50 mg/kg). (E) Data are the number of BrdU+ cells in the subgranular zone with error bars reflecting SEM. *p < 0.05; †p < 0.05 saline control vs. saline ethanol. n = 7-8/group. GCL = granule cell layer. Scale bar = 100μm; inset = 40μm.

