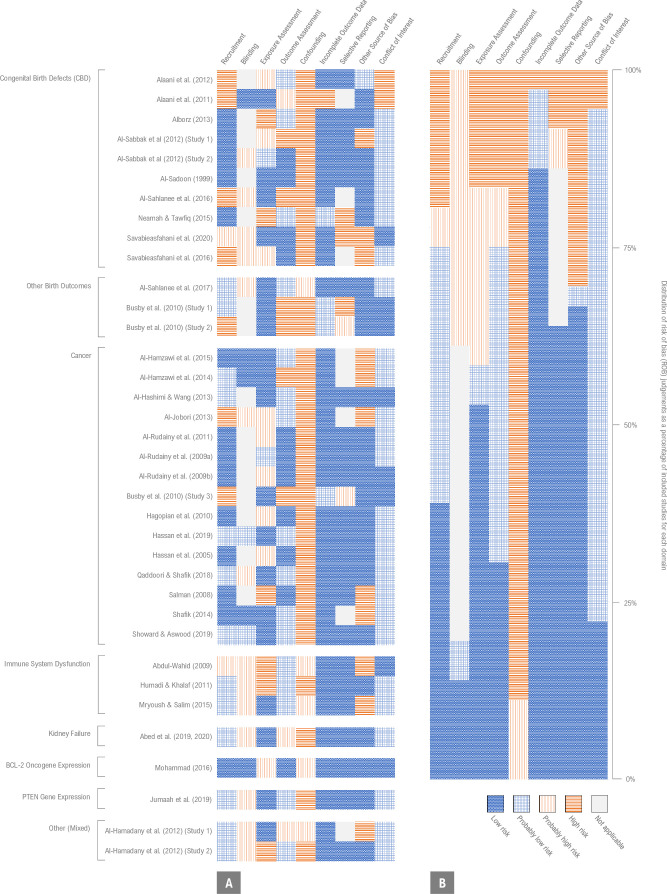
Figure 3.
Risk of bias assessments (low, probably low, probably high and high risk) for each included study (A) and given as percentages across all included studies (B). Justifications for risk of bias determinations for individual studies are provided in the online supplemental material 1, tables S13–S48.

