Figure 1:
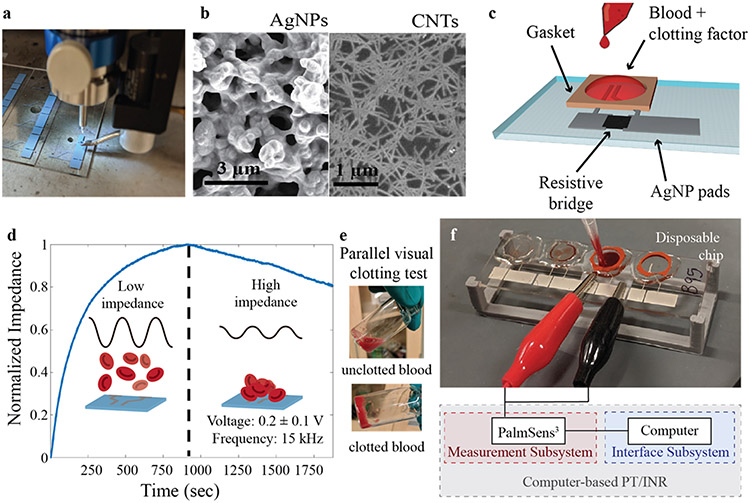
Printed prothrombin time device fabrication and testing. a) AJ printing of AgNPs for PT/INR device. b) SEM images of (left) AgNP electrode and (right) unsorted carbon nanotube conductive resistive bridge. c) Schematic of device design. d) Representative impedance curve illustrating coagulation test for chicken blood with e) a parallel visual clotting test. The dashed line represents the clotting time as determined by the impedance maximum and the gelatinization of the blood. Before the blood clots, the red blood cells are floating in solution (d – left insert, e - top) and thus the impedance is low; as the blood clots, the red blood cells deposit onto the device and cause the impedance to increase (d – right insert, e - bottom), maximizing at the point of clotting. (f) Picture of testing setup showing blood addition to the sensor and schematic of computer-based impedimetric testing interface.

