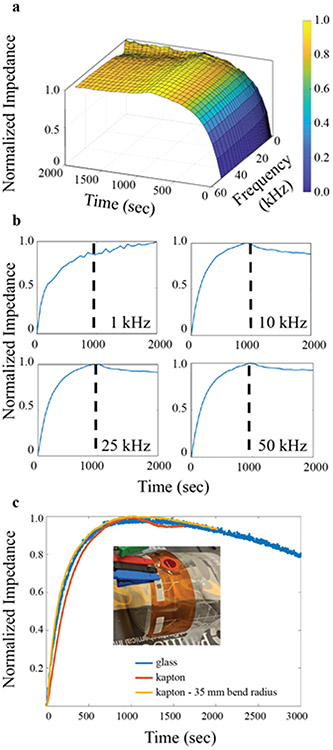
Figure 2.
Impedance-based coagulation testing of chicken blood with printed biosensors. a) Response from sensors tested at frequencies ranging from 1 to 50 kHz over the course of a complete clotting test, revealing the unstable response at sub-10 kHz frequencies. b) Single frequency cross-sections of the full data in a) at 1 kHz (top left), 10 kHz (top right), 25 kHz (bottom left), and 50 kHz (bottom right). c) PT tests using printed biosensors on various substrates: glass (blue), a Kapton polyimide substrate (orange), and a Kapton polyimide substrate bent at a radius of 35 mm (yellow) with a photo insert of the clotting time test performed while under strain.

