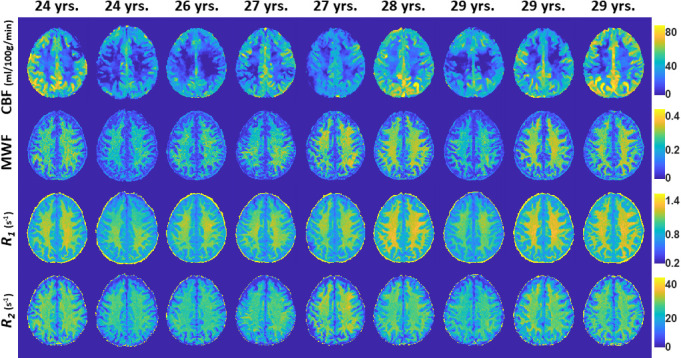
Figure 1.

Examples of MWF, R1, R2 and CBF maps of participants drawn from the limited age range between 24 and 29 years. Results are shown for a representative slice. Visual inspection indicates that, overall, participants with the lowest regional MWF, R1 or R2 values exhibit the lowest regional CBF values, while participants with the highest regional MWF, R1 or R2 values exhibit the highest regional CBF values. CBF, cerebral blood flow; MWF, myelin water fraction; R1, longitudinal relaxation rate; R2, transverse relaxation rate.
