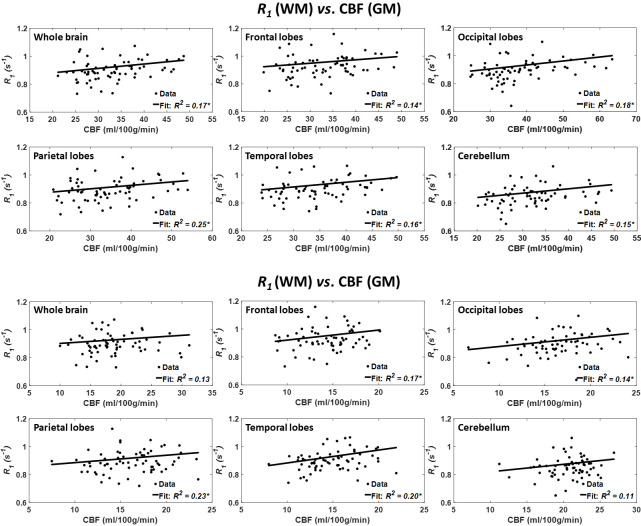
Figure 3.
Regressions of R1 with CBF (n=67). Results are shown for six brain ROIs associated with particular structures. For each ROI, results are shown for CBF values derived from grey or white matter. The coefficient of determination, R2, of the multiple linear regression model is reported with the symbol *, indicating significance at p<0.01. Except the whole brain and cerebellum WM, all ROIs exhibited significant positive correlations between R1 and CBF. Note that analysis was restricted to WM ROIs for R1 and to cortical GM or WM for CBF. CBF, cerebral blood flow; R1, longitudinal relaxation rate; ROI, region of interest.

