Figure 2.
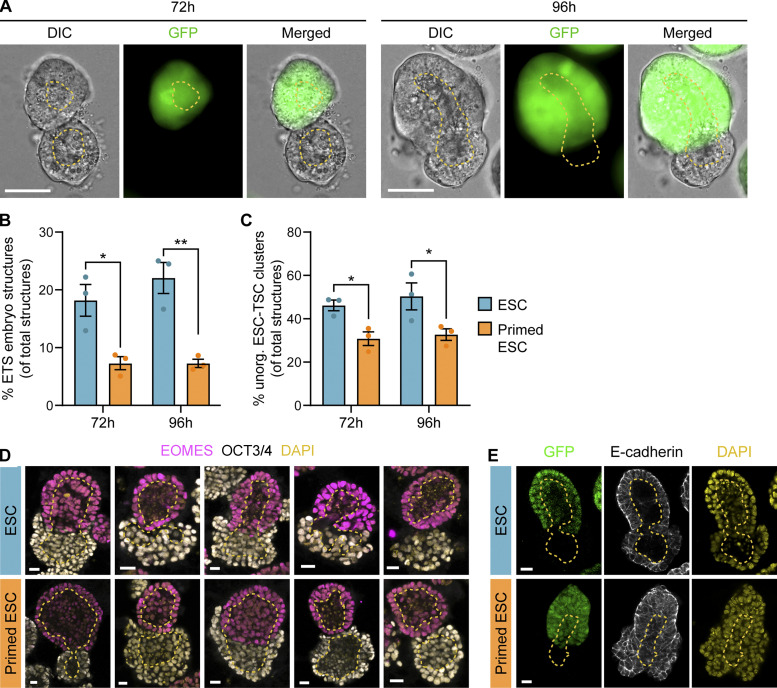
pESCs have a reduced ability to form synthetic embryo-like structures. (A) Representative DIC, GFP, and merged images of ETS embryo structures after 72 h and 96 h of co-culture. TSCs constitutively express GFP. At 72 h, opposing TSC and ESC clusters with internal cavitation are observed. At 96 h, larger structures with merged cavities appear. Dashed yellow line outlines cavities. Scale bars, 50 µm. (B and C) Proportion of structures formed by ESCs (blue) or pESCs (orange) at 72 h and 96 h of co-culture with TSCs. (B) Proportion of ETS embryo structures. Values are percentage of total structures (i.e., ETS embryo structures plus unorganized ESC–TSC clusters plus TSC clusters plus ESC clusters). For detailed quantification, see Fig. S1, B, I, and J. (C) Proportion of unorganized ESC–TSC clusters. Values are percentage of total structures (same as B). For extended quantification, see Fig. S1, B, I, and J. For B and C, n = 3, ≥80 total structures per n. Bars are mean, and error bars are SEM. Statistical significance calculated by two-way ANOVA with Šídák’s multiple comparison test: *, P < 0.05; **, P < 0.01. (D and E) Representative images of ETS embryo structures formed by ESCs (blue, top) and pESCs (orange, bottom) after 96 h of co-culture with TSCs. (D) ETS structures are labeled with antibodies against EOMES (magenta) and OCT3/4 (white) plus DAPI (yellow), presented as merged. (E) ETS structures labeled with antibodies against E-cadherin (white) and DAPI (yellow). TSCs express GFP. For D and E, yellow dashed lines indicate internal cavities. Scale bars, 20 µm.

