Figure 7.
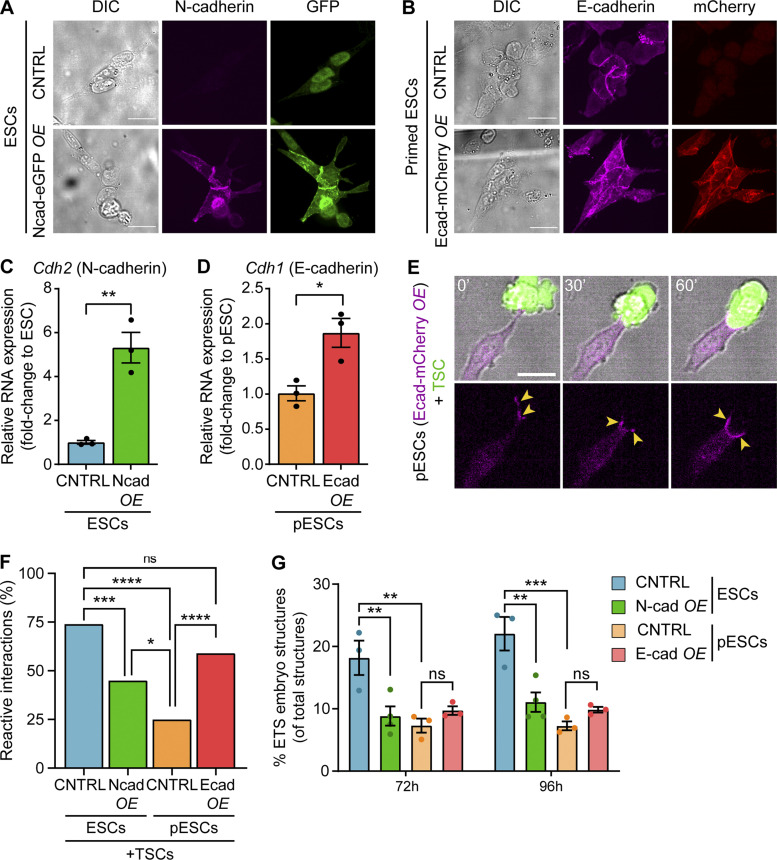
E-cadherin overexpression in pESCs improves their pairing with TSCs but cannot sustain synthetic embryogenesis. (A) Representative images of control (CNTRL) or N-cadherin–eGFP—expressing pESCs stained with antibodies against N-cadherin (magenta) and GFP (green). For each staining, images are shown at equal intensity ranges to allow comparison between panels. Scale bars, 20 µm. (B) Representative images of CNTRL or E-cadherin–mCherry-expressing pESCs stained with antibodies against E-cadherin (magenta) and mCherry (red). For each staining, images are shown at equal intensity ranges to allow comparison between panels. Scale bars, 20 µm. (C and D) Cdh2 (N-cadherin) and Cdh1 (E-cadherin) RNA expression levels in CNTRL or overexpressing ESCs (C) or pESCs (D), presented as fold-change to the control population. Bars are mean of n = 3 experiments. Error bars are SEM. Statistical significance calculated by unpaired two-sided t test: *, P < 0.05; **, P < 0.01. (E) Representative frames of a time course live imaging showing a pESC overexpressing E-cadherin–mCherry (magenta) contacting and pairing with a TSC (green). Yellow arrowheads indicate high levels of E-cadherin at the cell–cell contact zone. Time in minutes. Scale bar, 20 µm. (F) The percentage of reactive interactions (defined in Fig. 3, A and B) between CNTRL ESCs (blue), ESCs overexpressing N-cadherin (Ncad OE, green), CNTRL pESCs (orange), or pESCs overexpressing E-cadherin (Ecad OE, red) and TSCs. n ≥ 63 cells pooled from ≥3 independent experiments. Statistical significance calculated by multiple Fisher’s exact two-sided tests: ns, nonsignificant, P > 0.05; *, P < 0.05; ***, P < 0.001; ****, P < 0.0001. (G) The percentage of ETS embryo structures over the number of total structures (i.e., the sum of all quantified structure types, according to Fig. S1 B) in CNTRL ESCs (blue), ESCs overexpressing N-cadherin (green), CNTRL pESCs (orange), and pESCs overexpressing E-cadherin (red). Bars are mean of n ≥ 3, ≥80 total structures/n. Error bars are SEM. Statistical significance calculated by two-way ANOVA with Tukey’s multiple comparisons test: ns, nonsignificant, P > 0.05; **, P < 0.01; ***, P < 0.001. A complete breakdown of the quantification can be found in Fig. S1, I and J.

