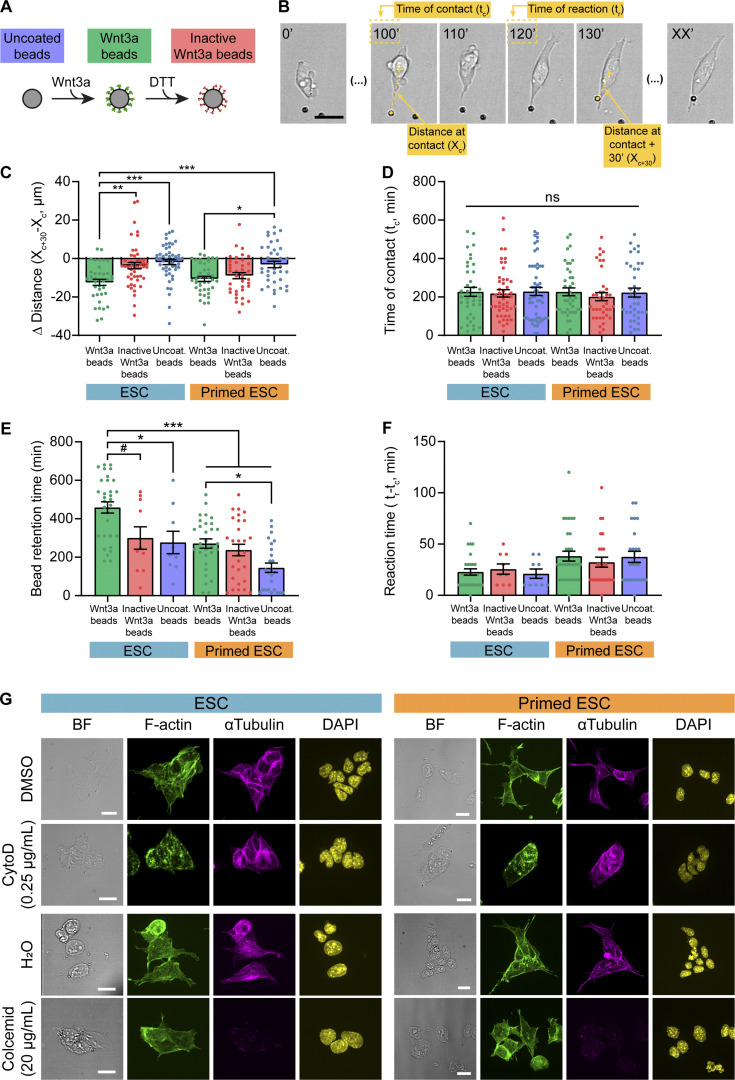
Figure S3.
Quantification of ESC or pESC interaction with Wnt3a or control beads, and representative images of cytochalasin D or colcemid treatment. (A) Schematic depicting the three types of beads used in the experiments. (B) Representative annotated frames of a time-lapse live imaging of an ESC contacting and recruiting a Wnt3a bead though a cytoneme. Annotations refer to measurements in C, D and F, as follows: distance between the cell and the bead at the time of cytoneme-mediated contact (“Distance at contact”; Xc); time at initial cytoneme-mediated contact (“Time at contact”; tc); distance between cell and bead 30 min after contact (“distance at contact + 30 minutes”; Xc+30; found empirically to be enough to capture the behavior of the cells after initial bead contact); time at which the bead is recruited by the cell (“Time of reaction”; tr; only quantified for reactive interactions). Scale bar, 20 µm. (C) Quantification of the differential between distance at contact (Xc) and distance at contact + 30 min (Xc+30) expressed in micrometers, for all conditions. n ≥ 40 cells pooled from ≥3 independent experiments. (D) Quantification of the time of ESC bead initial contact with a cytoneme (tc, in minutes). n ≥ 40 cells pooled from ≥3 independent experiments. (E) Quantification of the time of bead retention after reaction (in minutes) for all conditions. Bead retention time is only calculated for cells that react (according to Fig. 3 C). Data for ESC or pESC with Wnt3a beads are reused from Fig. 3 E. n ≥ 9 cells pooled from three experiments. F. Quantification of the reaction time, calculated as the difference between time at contact (tc) and time at reaction (tr) in minutes, for all conditions. Reaction time is only calculated for cells that react (according to Fig. 3 C). Data for ESC or pESC with Wnt3a beads are reused from Fig. 3 E. n ≥ 9 cells pooled from three experiments. For C–F, bars indicate mean, and error bars are SEM. Symbols indicate statistical significance calculated by one-way ANOVA with Tukey’s multiple comparison tests: ns, nonsignificant, P > 0.05; #, P = 0.051; *, P < 0.05; **, P < 0.01; ***, P < 0.001. (G) Representative images of ESCs (blue, left) or pESCs (orange, right) treated with DMSO, 0.25 µg/ml cytochalasin D (CytoD), H2O, or 20 µg/ml colcemid (top to bottom) for 4 h, and stained with antibodies against α-tubulin (magenta) or phalloidin (F-actin, green) and DAPI (yellow). BF is brightfield. Scale bars, 20 µm.

